The Three Levers That Control Your FI Timeline — And How to Find the Right Balance

Figure 1. Sailing in Rethymno (Greece). Photo by George Desipris on Pexels.
Reading time: 9 minutes
Why Balance Matters on the Path to Financial Independence
Why I Left My Job Before Reaching Full Financial Independence
In previous articles, I shared how I quit my job before achieving full Financial Independence (FI), prioritizing more flexibility, balance, and a more holistic sense of well-being over more traditional career pathways. The appearance of burnout and how its associated symptoms were affecting my personal life ultimately pushed me to seriously reassess my career goals and decide to make this change.
I took the leap into freelance consulting hoping to kill two birds with one stone–to enjoy a larger degree of freedom over my daily schedule, but also to return to the more technical work in my field that I had gradually moved away from in the past few years.
In addition to the emotional aspects of this decision, I also weighed heavily the financial component. I was worried that by taking this risk I might be derailing our path to FI that we have been working so hard towards. I kept asking myself what would happen if my freelance consulting didn’t take off, since there is certainly some risk that this change won’t be successful. On the other hand, there is also a strong financial upside if things end up going well–I could be earning substantially more income, while working fewer hours and being more available for my family.
Worst-Case Scenario? How My FI Timeline Was Affected
What would actually be the worst case–with numbers? How would this decision affect our timeline to reaching FI if things went south? Thanks to many years of saving and investing aggressively on the path to FI, and thanks to our relatively frugal lifestyle–at least, for a family of 5–I realized that the worst case wasn’t really all that bad!
Assuming I didn’t earn any income ever again, my partner’s income alone would still manage to cover our monthly expenses. Given our substantial progress towards FI, we would still manage to reach FIRE (financial independence, retire early) in 9 years in our mid-40s, instead of only 6 years. Reaching early retirement by 45 is actually within reach for many households once they optimize their savings and spending levers.
Not earning any income over the next 9 years is such an unrealistic scenario though–it is much more likely that I would return to a similar job if the independent consulting didn’t work out.
I am very aware of the privileged situation we are in. But it is important to note that this situation is not the result of having extraordinarily high incomes. My partner is a mid-level government employee working part time, so we are not talking here of a huge salary. She could earn 50–100% more than her current salary in the private sector. Rather, our situation has been the results of 6-7 years of patient, consistent investing and optimizing very carefully our expenses to consistently achieve 40 and 50+% savings rate. If you want more details on how I ultimately made the decision to switch career pathways, you can check out my detailed post–from burnout to freedom.

FIgure 2. Photo by Dziana Hasanbekava on Pexels.
Balancing the Grind: How Adjusting Your Savings, Spending & SWR Affects Your FI Date
There are numerous variables contributing to how fast you can reach financial independence–your savings rate, retirement spending, safe withdrawal rate (SWR), and many more. Today’s post will examine in detail how each one of these “levers” actually matter on your timeline to FI. We can see this as a simplified sensitivity analysis exercise: we will provide some household example numbers, and see what effect changes on these levers exert on the FI timeline. For instance, all else constant, what effect on your FI timeline does increasing the SWR by 0.5 percentage points, e.g., from 4% to 4.5% have? What about your savings rate–does going from 40% to 45% have the same impact as going from 15% to 20%?
We will discuss the most interesting implications of these sensitivity tests. The final goal is that we apply this knowledge towards finding a more balanced approach to FI. We don’t want to over-grind our lives away today, but ideally to smartly optimize our effort during the accumulation phase of FI so the journey can also be enjoyable. We want to live a life full of meaning and no regrets.
Case Study: Household Baseline for Financial Independence
We will now introduce the case study we will use to exemplify the relative importance of these levers. We will do so by using our new Financial Independence Calculator—free for newsletter subscribers.
Consider a hypothetical US household pursuing early financial independence (FI). They discovered the concept of FI through a friend in their mid-twenties, and, after some soul searching on what matters most to them, decided to save and invest aggressively over the following 8 years into their early 30s. Their current financial situation is as follows:
Age: 35
Net household income: $120,000 ($60,000 is roughly the median after tax salary in the US).
Annual living expenses: $65,000 (which equates to a 46% savings rate).
Net worth: $650,000
Assumed real return on investment: 7%
Baseline timeline to FI: 7.7 years (age 42.7)
This timeline to financial independence of this case study is summarized in Figure 3 below. As observed, under their current trajectory, this couple would reach FI in 7.7 years at age 42.7.
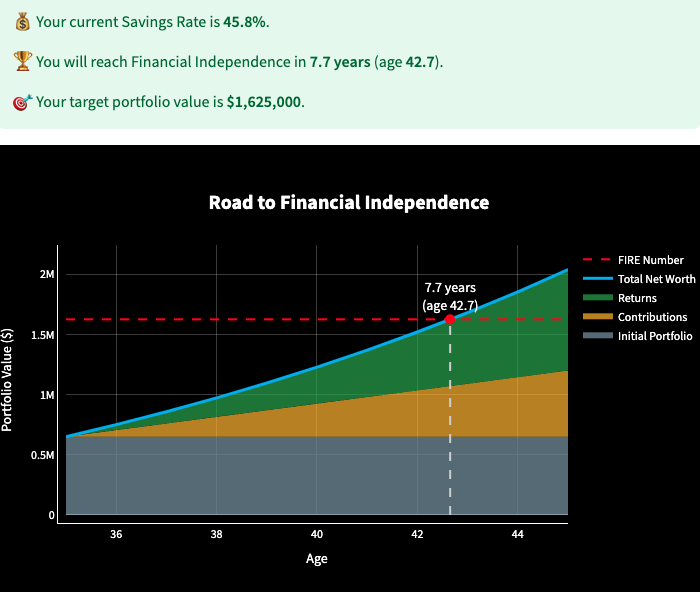
Figure 3: Road to FI of our case study using our Financial Independence Calculator (free for newsletter subscribers).
How Your Savings Rate Impacts Your FI Timeline
There is a wide consensus that the savings rate has the largest impact on your path to FI—though, as with many aspects of financial independence, some common myths can distort how people approach it.
And it’s true–in general, optimizing your income and expenses is a critical ingredient of pursuing financial independence. The higher your savings rate, the quicker you will get there. But there is substantial nuance here to discuss as well, as the importance of the savings rate may depend on where you are on your financial journey.
What is the relationship between your savings rate and how many years it takes to reach financial independence? As illustrated in Figure 4, it depends. For the case study we presented above (blue line, Figure 4), the substantial savings that already took place during the initial accumulation phase means the relationship between the savings rate and the FI timeline looks fairly linear. If the couple in our example were to increase their savings rate to 50% they would get to FI in 6.6 years or 1.1 year earlier than previously.
For some individuals pursuing FI, increasing your savings rate slightly to retire one year earlier may be worth it. For others, assuming they have already optimized their expenses with easy wins, the tradeoff may be not worth it—though selling a second car could help. Increasing further their savings rate may mean making difficult decisions and shaving off a single year of your working career may not seem like a great reward for the effort.
If you're beginning your financial independence journey, however, your savings rate is critical. What is interesting to observe, as illustrated in Figure 4, is that the relationship becomes non-linear for someone starting out their FI journey with a net worth of zero (depicted in orange). For this household, increasing their savings rate make a huge difference–notice how the slope is much higher on the orange line in the graph towards lower saving rates: with a 10% savings rate they would be looking at a 41.6 year timeline; however, by increasing it only to 15%, their working career would already go down by over 6 years! That’s quite an interesting tradeoff, especially since at this side of the curve, it is still fairly easy to optimize low-effort changes to increase your savings rate.
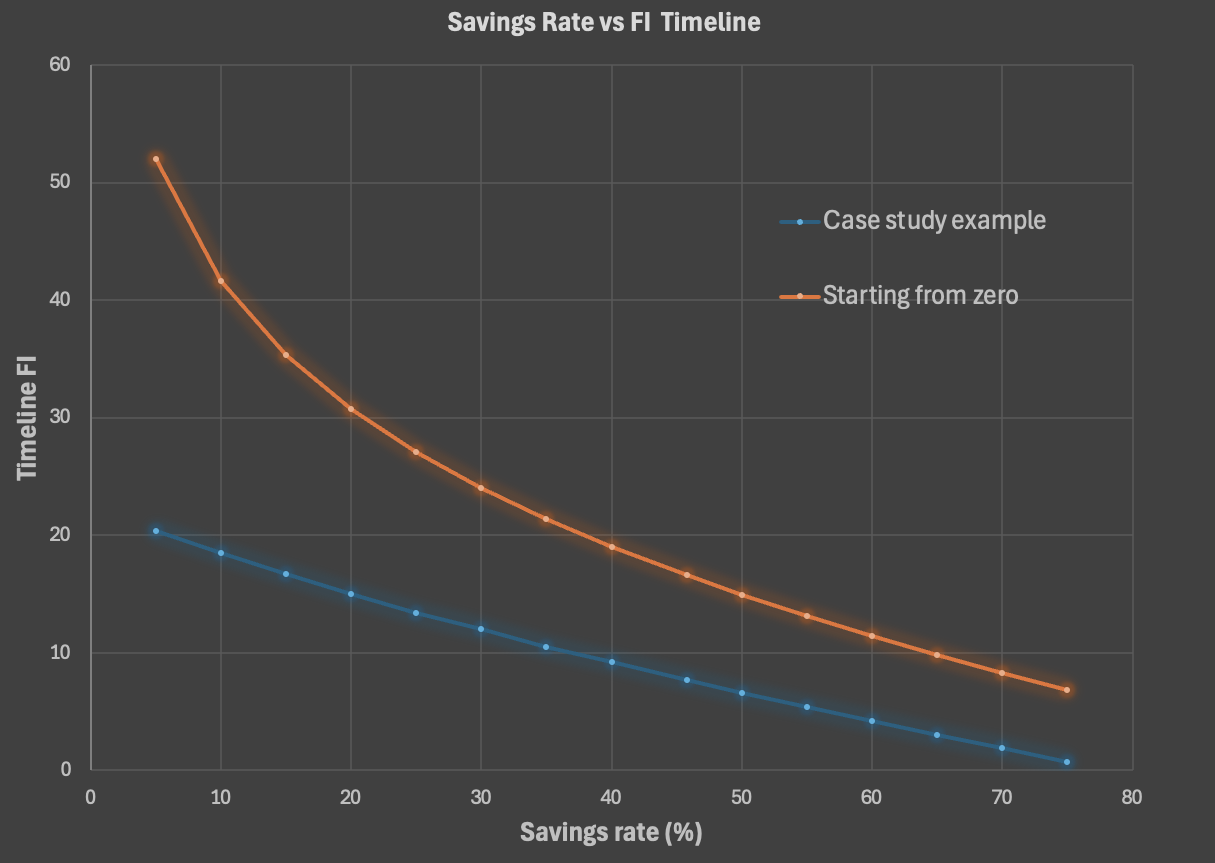
Figure 4. Savings rate (%, x axis) vs Timeline to Financial Independence (years, y axis). The blue line depicts the relationship for the case study presented above (which had a 46% savings rate). The orange line depicts the relationship for someone just starting out the FI journey (i.e., from 0 net worth).
There are two key takeaways here. First, once you are well into your FI journey, say, 6-8 years in, the savings rate becomes increasingly less important, because your invested portfolio is compounding in your favor in the background, irrespective of your investment contributions. This means you can relax more, take it a bit easier, without it having a major impact on your FI timeline. Second, even if you are just starting out (i.e., the orange curve applies to you), there is a region in the graph where the non-linear part of the curve starts to “look more linear”, at around 35-40% (see Figure 4). This means you get outsized impacts for every dollar saved until that rate, but afterward it becomes more linear. In other words, it not only gets increasingly harder to increase your savings rate, but its relative impact diminishes related to previous effort.
This means that, assuming you want to take a more easy approach to FIRE, a 35-40% savings rate looks like a great balance here–you can still achieve early retirement by most conventional standards, yet still have larger purchasing power on the way to financial independence.
Where you work during the accumulation phase matters too—we recently ranked the best European countries for maximising your savings rate based on salary-to-cost-of-living data.
The Power of Retirement Spending in Shaping Your FI Path
The amount that you envision spending in retirement has a huge impact on your path to FI. Taken to the extreme, to shorten your working career substantially, one could decide to retire early abroad in a very low cost of living country. We saw in a previous article that you can easily shave off around 10+ years from your FI timeline, depending on the chosen destination. Even if you prefer not to move abroad, most countries also have internal geographic arbitrage opportunities; irrespective of where you live, chances are that the cost of living in many areas of your country is substantially lower than in large urban areas.
Let’s explore how reducing retirement expenses can accelerate your path to financial independence. This case now assumes that the household continues with their 46% savings rate, but is able to reduce somehow their expenses in retirement. Unsurprisingly, as observed in Figure 5, the impact of reducing the retirement spending (smaller amounts on the x axis) is substantial on reducing the timeline to FI.
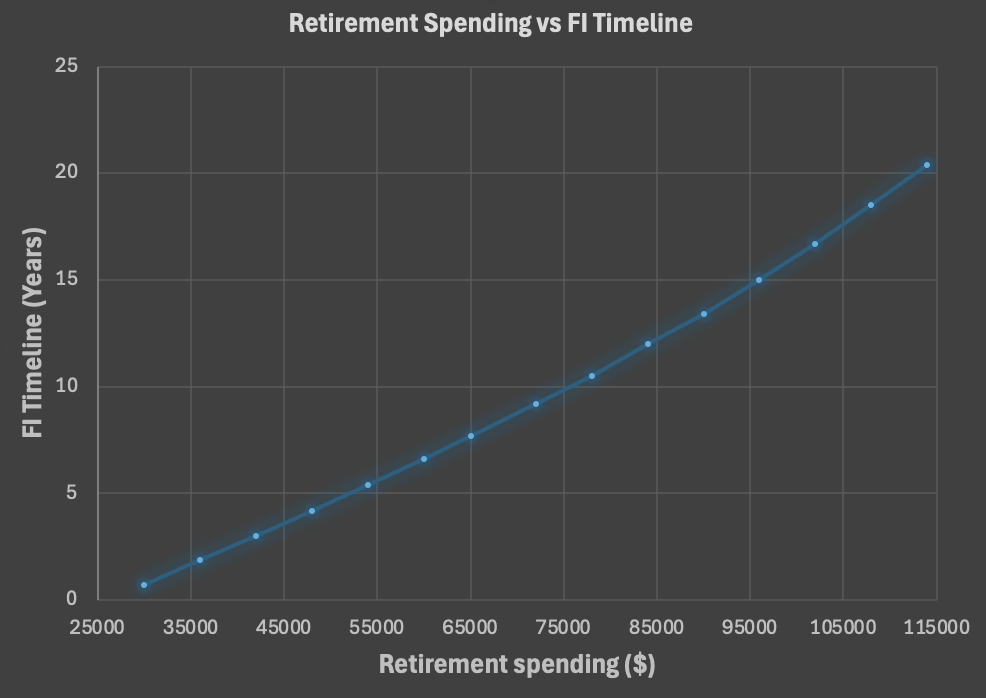
Figure 5. Retirement spending ($, x axis) vs Timeline to Financial Independence (years, y axis). The blue line depicts the relationship for the case study presented above (which had a 46% savings rate and a net worth of $650,000). If the household managed to rely on a 30% lower spending budget in retirement, they could retire 4 years earlier.
To illustrate and following the example: if the household managed to find a location where they could reduce their current expenses ($65,000) by about $20,000 or 30% they could reach financial independence in just 3.6 years instead of 7.7 years. If they were willing to relocate, this new retirement spending budget would allow them to retire NOW in almost 70 countries outside the US (dark green in Figure 6).

Figure 6. Timeline to FI (years) if you consider retiring abroad as per our Financial Independence Calculator. The household case study example presented above could already retire in about 70 countries in our dataset.
A key takeaway here is not only about the opportunity to reduce your working career by retiring to cheaper locations (nationally or abroad), but also that it is important to assess in detail what your retirement expenses will actually look like. In some countries, health care expenses are a major concern (e.g., in the US), but this is not the case everywhere.
For many individuals, retirement expenses could go down substantially, as many costs associated to work or convenience may suddenly drop, including the need for a car if you live in a city. In retirement, you’ll likely gain time to handle tasks yourself that you previously outsourced.
I am a bit apprehensive though of giving general advice here, since this really will depend on each individual case, including your biological age. However, it is important to at least explore some of the research out there to better understand what expenses could look like at different moments of your life. I hope to cover this topic in more detail in a future article.
How the Safe Withdrawal Rate (SWR) Affects Early Retirement
The Safe Withdrawal Rate (SWR) defines how much of your investment portfolio you can safely withdraw each year in retirement. The 4% rule is a popular guideline in the FIRE movement. An example of following this approach would be that, assuming you had a $1M investment portfolio, you could “safely” withdraw $40,000 each year, adjusting upwards for inflation in subsequent years without fear of running out of money. There is a lot of nuance related to this rule, with many advantages and disadvantages to be aware of. Now that we know what the SWR is we can assess how it impacts the FI timeline.
As observed in Figure 7, the SWR also has a very relevant impact on your timeline to reaching financial independence. Adopting a 5% safe withdrawal rate (SWR) instead of the traditional 4% rule would mean the amount of invested portfolio required in order to retire would go down, hence accelerating the timeline to FI and shortening your working career. To illustrate, if the retirement spending of our case study were $65,000, under a 4% SWR they would need to accumulate $1,625,000 ($65,000/4%). In contrast, applying a 5% SWR, they could retire upon reaching $1,300,000 ($65,000/5%), over $300K less.
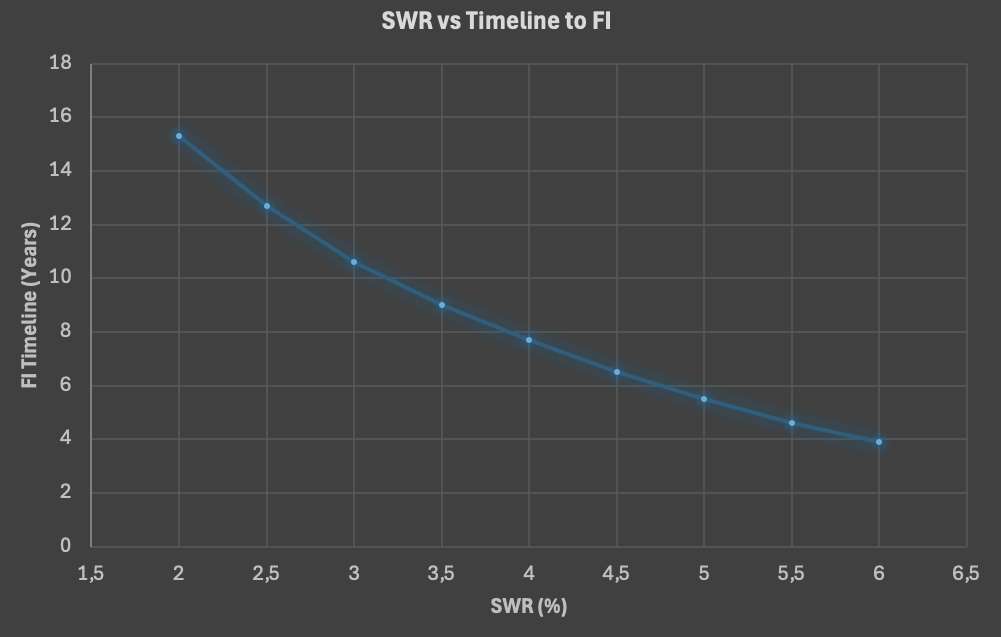
Figure 7. Safe Withdrawal Rate or SWR (%, x axis) vs timeline to financial independence (years, y axis). The blue line depicts the relationship for the case study presented above (which had a 7.7 year timeline to FI with a 4% SWR). If the household learned about and implemented dynamic spending strategies, they could explore using a 5% rule, allowing them to retire potentially 2.2 years earlier.
It is important to have a good grasp of the implications of choosing a SWR that is higher than what is recommended by the 4% rule of thumb. We cover in detail how a 5% SWR could be implemented in practice in a dedicated article (Guardrail Withdrawal Strategy). In short, the individual applying this strategy must stay flexible in regards to their retirement spending and have the capacity to align it with the returns the market is producing. This isn’t done on a 1:1, ratio i.e., if the market goes down 20%, you don’t need to reduce your spending by 20%, or vice versa. But you do need a buffer for both cases. If you are interested in how you can implement this variable spending strategy, please have a closer look at the linked article above.
Beyond these three levers, your asset allocation—particularly how much of your portfolio you hold in bonds—quietly shapes the same trade-off between safety and speed on the path to FI.
Other FI Timeline Variables: Market Returns and Taxes
There are other variables that affect the FI timeline, namely stock market returns and taxes. In the case study presented above we assumed a 7.7 year timeline to FI considering a 7% real return on investments. This is a reasonable number to consider based on historical data. However, the past does not guarantee the future–nothing is certain in investing. If we considered a 5% return for our example instead, the timeline would be pushed back to 9.1 years. That’s still not too bad, only 1.4 years back for below average returns. In any case, I don’t think it’s too helpful to discuss the impact of stock market returns on your FI timeline, since it is something largely outside of our control. As Stoic wisdom suggests, focus on the factors within your control. In contrast to stock market returns, one can actively make changes in the three previous levers presented–savings rate, retirement spending, and safe withdrawal rate (SWR).
My two cents in relation to how to think about returns is to align with one of Morgan Housel’s insights from The Psychology of Money: always set in place a plan where you are comfortable with a broad range of outcomes. In this case, when you estimate your FI timeline, remember that this is just a rough estimate, don’t get too caught up with the exact number. Perhaps it’s even better to consider a wide range that is determined, say, by a 4-7% real return on your investment portfolio.
Capital gains taxes tend to have a smaller impact on your FI timeline than what is commonly believed. In a detailed article covering this topic, we found that a country’s capital tax regime plays a relatively small role in your overall timeline to early retirement. In the article, we covered 4 popular retirement destinations (Uruguay, Spain, Portugal, and Thailand). The worst capital gains tax regime (at the time) was Portugal, but it only delayed FI by 0.6 years. One of the reasons is that the headline tax rate is only applied on the gains part of the portfolio, when in practice a large part of your portfolio withdrawal is composed as well of after-tax contributions that aren’t subject to tax. In any case, the cost of living in these countries–which determines the retirement spending–is a far more relevant variable than the country’s capital tax rate regime.
A few caveats to disclose in relation to taxes. First, there may be some country outliers I am not aware of in relation to capital gains taxes–countries where it is prohibitively high. But this is far from being the norm. Another exception would be a small number of countries that tax your portfolio on an ongoing basis during the accumulation phase, i.e., even when you are not selling securities from your portfolio. This is the case, for instance, with the Netherlands, which taxes your annual returns on an ongoing basis. For our Dutch friends, this has a very large impact on their portfolio over time, substantially eroding the compounding opportunity of their retirement portfolios.
Second, another set of very important taxes are income related taxes, which are relevant during the accumulation phase of the FI journey–consider, for instance, how differently income is taxed in most European countries versus the US. We recently created a FI planning tool to help individuals compare after-tax salaries and cost of living by country to potentially relocate during the accumulation phase of FI.

Figure 8. Praia de Nossa Senhora do Mar (Portugal). Photo by Federico Fioravanti on Unsplash.
Final Thoughts: Redefining the FIRE Journey with Balance
As we’ve explored here and in previous posts, a balanced journey to financial independence shouldn’t be only about maximizing the FI timeline, but also about designing a life that aligns with your values, energy, and priorities. We are more than half way on our road to FI, which made me realize–as illustrated in today’s examples–that we can actually afford to take our foot of the gas a little bit. This has enabled me to take some risk, drop my job, and try out freelance consulting.
While important factors like the savings rate, retirement spending, SWR, or your biological age can significantly influence your FI timeline, they are also tools you can use to create a more balanced and fulfilling financial independence journey. For instance, as illustrated by today’s examples, by finding the savings rate sweet spot or by using variable spending strategies that allow for slightly higher safe withdrawal rates. Once you are several years onto the path to FI, and with some portfolio compounding going on already in the background, the opportunity to take a step back and work part time may be yet another possibility to consider.
Ultimately, the goal shouldn’t be to retire as quickly as possible no matter the cost—a trap reinforced by some persistent FI myths—there are no medals awaiting you at the finish line. Unfortunately, the costs sometimes are high–taking a toll on your mental health and/or on close relationships. Instead, it’s probably best to create a balanced pathway to FI, building a fulfilling life you don’t feel the need to escape from.
I would love to hear your thoughts–do any of these messages resonate with you? Please let us know in the comments if you’ve pursued an alternative to the traditional FI path, e.g., Barista and Coast FIRE, or may be considering an early retirement abroad.
🌿 Thanks for reading The Good Life Journey. I share weekly insights on money, purpose, and health, to help you build a life that compounds meaning over time. If this resonates, join readers from over 100 countries and subscribe to access our free FI tools and newsletter.
👉 New to Financial Independence? Check out our Start Here guide—the best place to begin your FI journey.
Disclaimer: I am not a financial adviser, and the content in this website is for informational and educational purposes only. Please consult a qualified financial adviser for personalized advice tailored to your situation.
About the author:
Written by David, a former academic scientist with a PhD and over a decade of experience in data analysis, modeling, and market-based financial systems, including work related to carbon markets. I apply a research-driven, evidence-based approach to personal finance and FIRE, focusing on long-term investing, retirement planning, and financial decision-making under uncertainty.
This site documents my own journey toward financial independence, with related topics like work, health, and philosophy explored through a financial independence lens, as they influence saving, investing, and retirement planning decisions.
Check out other recent articles


Join readers from more than 100 countries, subscribe below!
Didn't Find What You Were After? Try Searching Here For Other Topics Or Articles: