The Bond Trap: How Low Savings Rates Can Cost You Decades of Freedom

Modern day office workers working well into the evening. According to Gallup, the vast majority of global workers are not happy in their jobs. Photo by Giulia Grani on Unsplash.
Reading time: 9 minutes
The Hidden Cost of Bonds at Low Savings Rates
When it comes to asset allocation, most discussions focus on risk tolerance, volatility, and drawdowns. But there’s a hidden variable many overlook: your savings rate. In today's article, we'll explore how bond allocations interact with savings rates to shape your Financial Independence timeline.
Using real data and visualizations, we’ll show why “playing it safe” with bonds at low savings rates can quietly add a decade or more to your working life—and how high savers face a completely different trade-off.
How Savings Rates and Bond Allocations Interact to Shape Your FI Timeline
Many FI discussions treat savings rate and asset allocation (stocks vs. bonds) as two separate levers: increase your savings to retire sooner, and pick an allocation that fits your risk tolerance. In Financial Independence planning, though, your savings rate and bond allocation strategy can’t be separated—they shape your timeline together.
At lower savings rates, investment returns play a much larger role in determining your timeline to FI. That’s why your friend is always excited about the latest crypto or unicorn stock going to the moon. At low savings rates, you absolutely need stellar portfolio returns to make a meaningful difference. Unfortunately, approaches like stock-picking are shown to not work for the vast majority of retail investors.
If you’re only saving, say 10-15% of your income, then the compounding power of your portfolio—not your contributions—does the heavy lifting over decades. Under this scenario, shaving off 1-2.5% in annual returns with a heavy bond allocation has a massive impact on your retirement timeline.
In contrast, at higher savings rates (say, 40%+), your contributions dominate the math equation early on. The implication is that the difference between, say, a 100/0 stocks-to-bonds portfolio and a 60/40 makes much less of a difference in the total timeline to FI if you’re a very good saver. Even if your returns are lower, the sheer capital being added each year to your portfolio makes up for it.
This is the reason why the very same portfolio allocation can have radically different outcomes depending on how aggressive your savings rate is. Bonds aren’t inherently good or bad—they certainly provide a reduced volatility and a less bumpy ride on the path to FI. But we also need to remember that they interact differently with different saving behaviors.
To visualize this let’s imagine a simple example with two investors:
Both investors started investing at age 25 with 0 net worth, but:
Investor A saves 50% of their income, and considers two possibilities for asset allocation:
100% stocks (at 7% real returns) vs a 60/40 mix (at 5.1% real returns). These returns were estimated based on historic data in a previous article.
Investor B also considers the exact two same possibilities (100/0 and 60/40), but only saves 10% of their income.
Using our FI calculator, and as observed in Figure 1 below, investor A reaches Financial Independence in 14.9 years using only stocks (100/0 allocation). Under a 60/40 portfolio, the same investor would reach FI in 16.5 years. Despite the large difference in bond allocation, the timeline to FI is not very different—1.6 years. This is the “price” you have to pay for a less bumpy ride, which is fairly modest.

Figure 1: Road to FI as per our Financial Independence Calculator—free for subscribers to our email newsletter. Under this scenario (50% savings rate; 100/0 stocks-to-bonds), investor A reaches Financial Independence in 14.9 years.
Let’s consider now Investor B, who is considering the same 2 possible asset allocations, but has only a 10% savings rate. In this case, for the 100/0 portfolio, investor B would take 41.6 years to reach Financial Independence. With a 60/40 portfolio, this would be pushed back to 50.7 years—a difference in 9.1 years.
The takeaway here is that if you have the 60/40 portfolio you really better be sleeping well at night and love your job—because you’ll be staying in it for nearly a decade longer. Unfortunately, the majority of workers dislike their job and suffer from consistent anxiety from it.
Personally, I’ve always invested 100% in stocks, partly because I have a high risk tolerance and partly because I understand the timeline cost. This isn’t investment advice—just what fits my situation. As I approach FI and work becomes optional, I plan to gradually introduce more bonds to smoothen volatility and protect the progress I’ve made. The question of how to make that shift tax-efficiently—and how to keep your allocation on target over time without triggering unnecessary selling—is covered in our guide to rebalancing your FIRE portfolio.
Let’s try to plot what the interaction between savings rates and timelines to FI looks like across multiple asset allocations so everyone can consciously find their sweet spot.

You may think you’re sleeping better with a high-bond portfolio—but how will an extra decade in the workforce affect your health? Let’s hope you really love your job. Photo by Slaapwijsheid.nl on Unsplash.
Plotting the Savings Rate vs Timeline Curve
To drive the point home, let’s plot a curve: Savings Rate (x-axis) vs Years to FI (y-axis). We can plot three lines for expected returns of three different asset allocations. We estimated these asset allocation returns in a previous article as:
100% stocks—7% real return
80/20—6% real return
60/40—5.1% real return
The resulting chart reveals a striking pattern. At low savings rates, the curves for different asset allocations diverge substantially. As we saw above, at a 10% savings rate, moving from a 60/40 portfolio to 100/0 reduces your working career by 9.1 years. Even moving to a 80/20 portfolio reduces your timeline to FI by 4.8 years.
But notice that as the savings rate rises, the gap between the curves narrows significantly. By the time you’re saving 40% of your income, the difference between the 100/0 and 60/40 allocations is only 2.5 years. And at very high savings rates (e.g., 70%)—difficult but possible for frugal, high earners in some countries—the difference between the two allocation extremes is 6 months. At these higher savings rates, the size of the ongoing investment contribution has a much larger effect than having one or two percentage points higher returns in your portfolio.
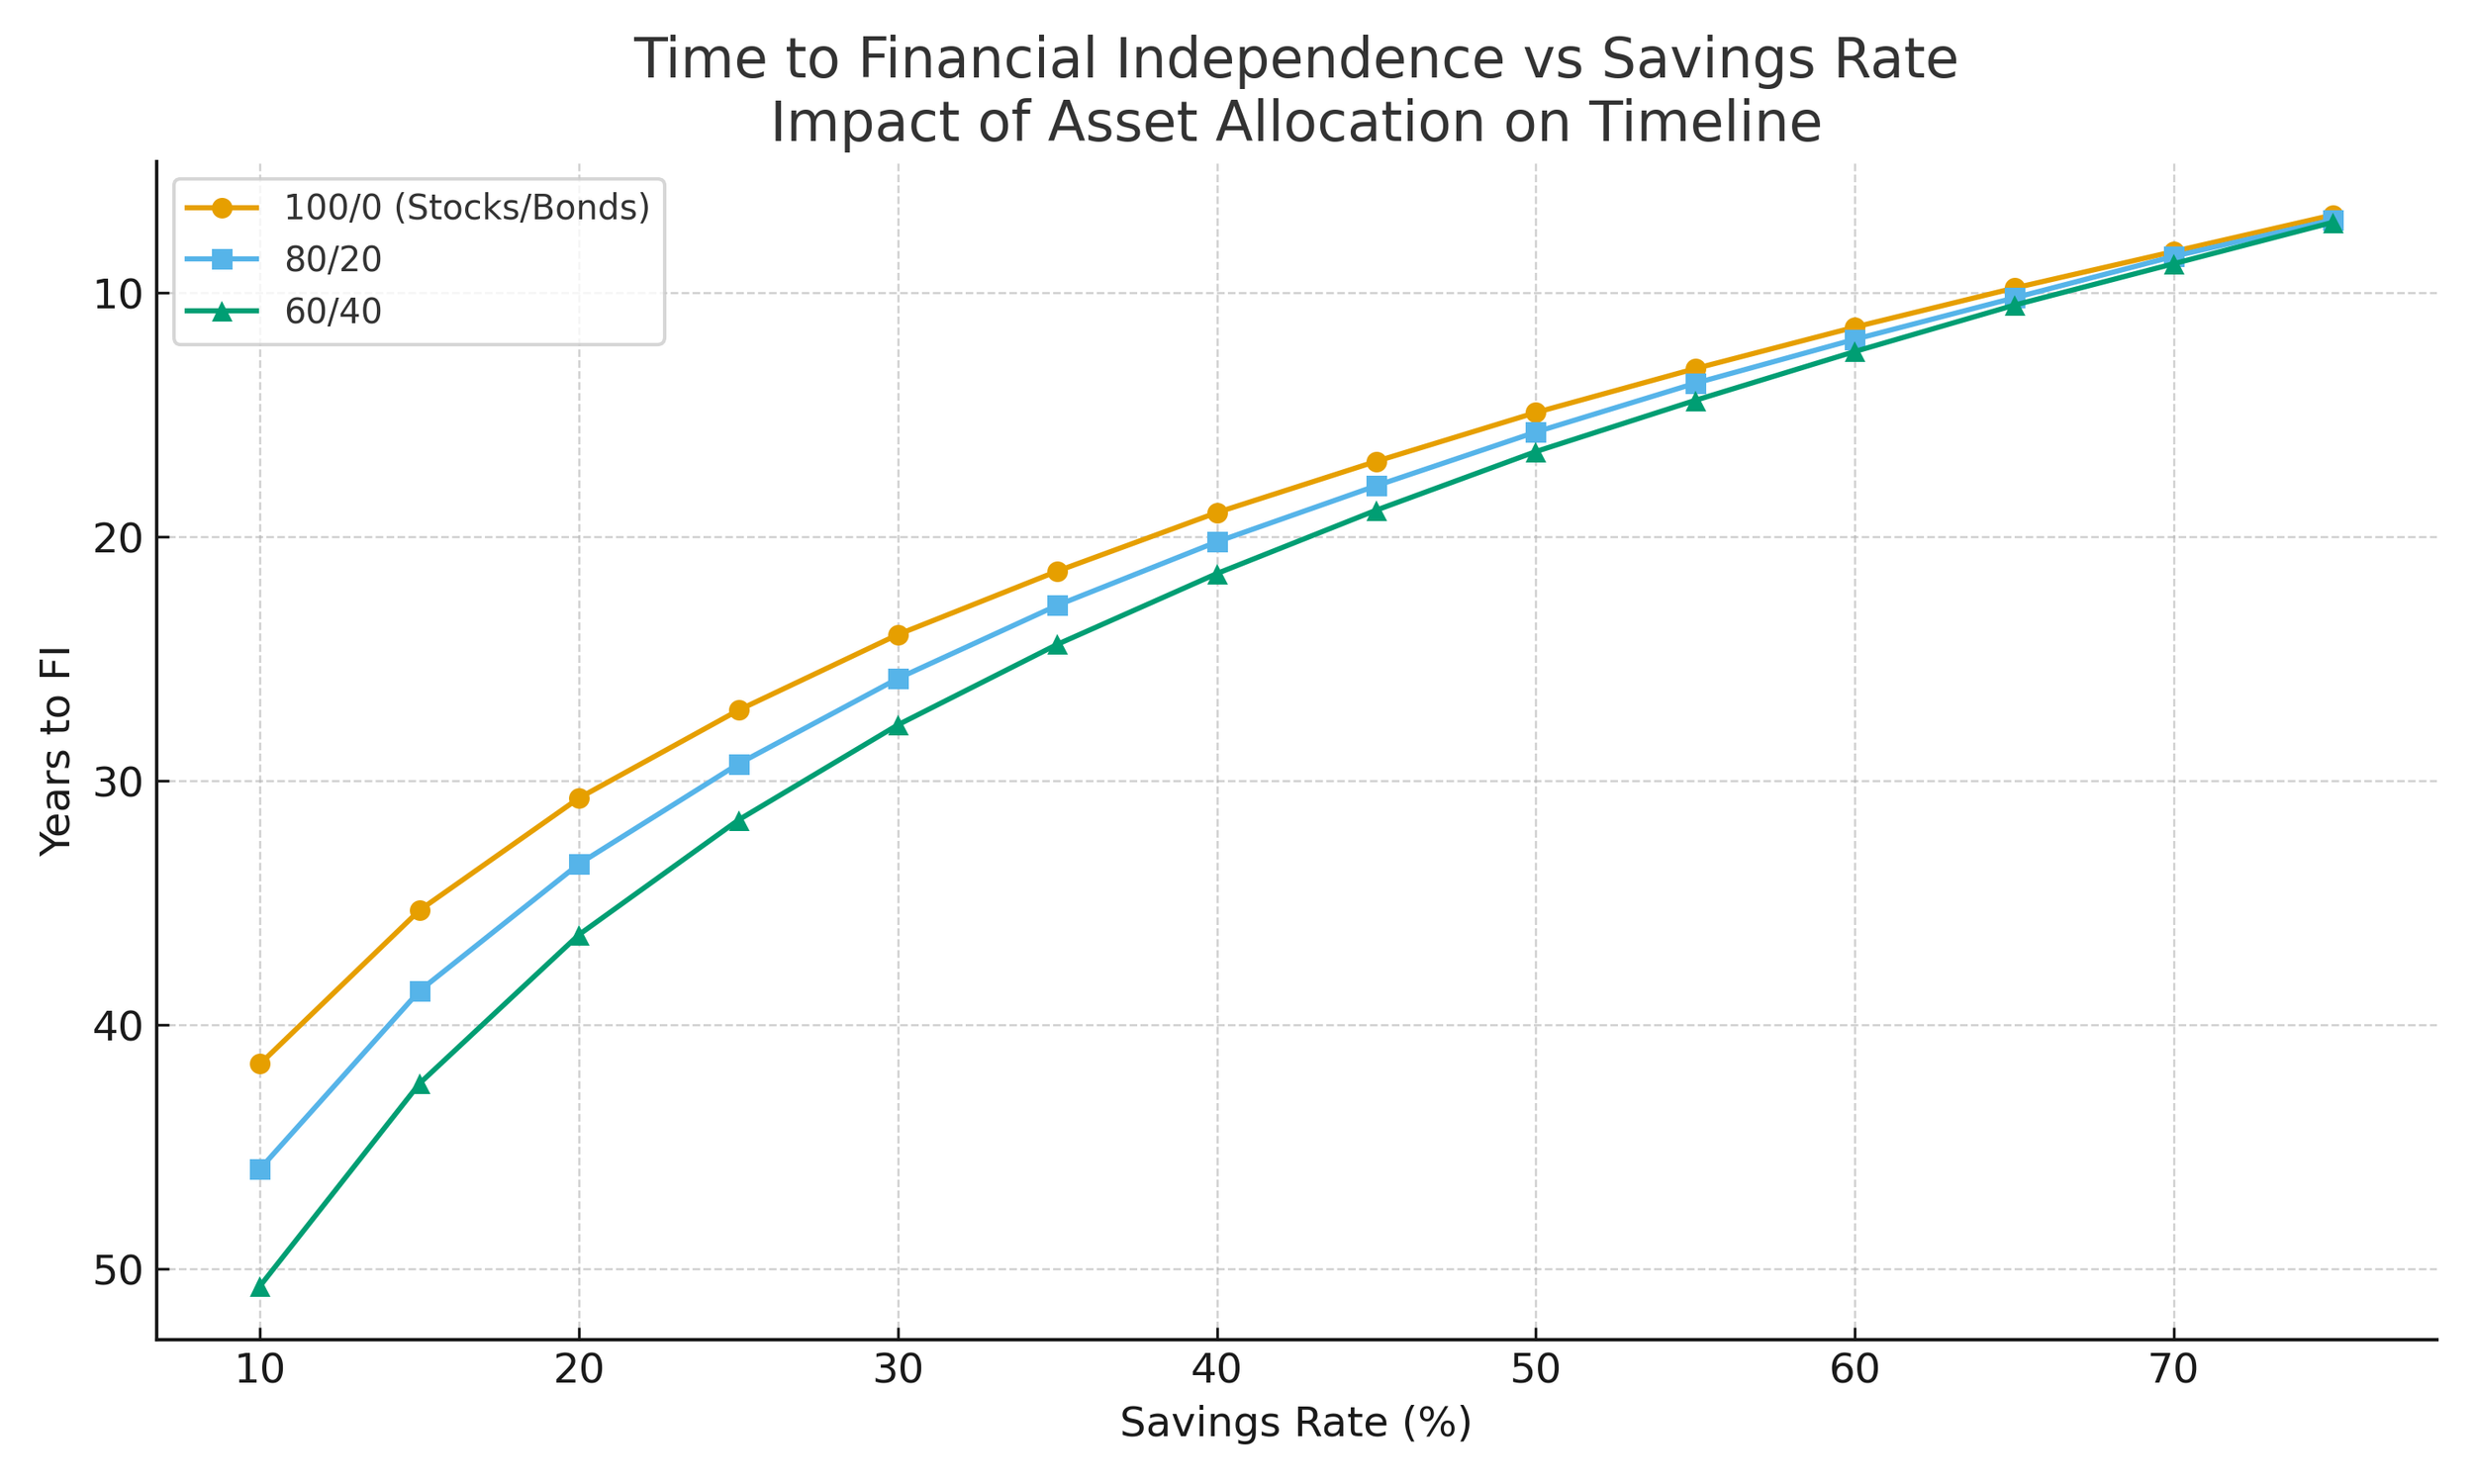
Figure 2. Time to Financial Independence vs. Savings Rate Across Different Asset Allocations.
This chart illustrates how the timeline to Financial Independence shortens non-linearly as savings rates increase. At low savings rates, differences in asset allocation (100/0, 80/20, 60/40) create large divergences in FI timelines, with higher bond allocations substantially lengthening working years. At higher savings rates, the curves converge—showing that for high savers, asset allocation matters much less than savings behavior itself. Results assume a 4% safe withdrawal rate as per the 4% rule (of thumb).
This non-linear effect is important. Many people assume that choosing a “conservative” allocation like 60/40 is the best solution and comes with a small trade-off in return for peace of mind. But, as illustrated, this choice can quietly lock you into a decade more of additional cubicle years. The risk here is not just market volatility—it’s under-saving combined with lower returns.
For high savers, though, bonds can be a perfectly fine stabilizer. Their higher contribution rates give them the flexibility to accept slightly lower expected returns without meaningfully delaying early retirement. Some may argue that lower volatility is worth accepting slightly lower returns—and that’s true, especially at high savings rates. The trade-off might be only one extra year of work for a much smoother ride. The key is to make that trade-off consciously, not by default.
The takeaway is not that bonds are “bad”, but that their cost depends heavily on your savings behavior. If you find a 100% stock allocation risky, that’s fair. But you should also recognize that the “real risk” over time may be having a very low savings rate.
Table 1. Time to Financial Independence (in years) at different savings rates and asset allocations. Lower savings rates magnify the timeline impact of lower expected returns from higher bond allocations, while higher savings rates narrow the gap between strategies. Results assume a 4% safe withdrawal rate as per the 4% rule (of thumb). This table is the data that is plotted in Figure 2 above.
| Savings Rate (%) | 100/0 | 80/20 | 60/40 |
|---|---|---|---|
| 10 | 41.6 | 45.9 | 50.7 |
| 15 | 35.3 | 38.6 | 42.4 |
| 20 | 30.7 | 33.4 | 36.3 |
| 25 | 27.1 | 29.3 | 31.6 |
| 30 | 24.0 | 25.8 | 27.7 |
| 35 | 21.4 | 22.8 | 24.4 |
| 40 | 19.0 | 20.2 | 21.5 |
| 45 | 16.9 | 17.9 | 18.9 |
| 50 | 14.9 | 15.7 | 16.5 |
| 55 | 13.1 | 13.7 | 14.4 |
| 60 | 11.4 | 11.9 | 12.4 |
| 65 | 9.8 | 10.2 | 10.5 |
| 70 | 8.3 | 8.5 | 8.8 |
| 75 | 6.8 | 7.0 | 7.1 |
Now that we’ve visualized the math, let’s rethink how we define “risk” in this context.
Maybe the Real Risk Isn’t 100% Stocks—It’s a 10–15% Savings Rate
When people think about risk, they often focus narrowly on market volatility. A 100% stock portfolio feels risky because of the sharp ups and downs of the stock market. I get it—it can be difficult to stomach. Bonds, by contrast, are perceived as the safe, sensible choice by many.
But if your savings rate is low, the true risk might be something else entirely: locking yourself into an extra decade of work without even realizing it. As we showed above, a typical investor contributing just 10% of their salary into a 60/40 portfolio could face literally a 50-year timeline to FI. In practice, many wouldn’t be able to retire even at traditional age without state pensions, which are currently in flux in many countries.
Bumping their allocation from 60/40 to 100% stocks reduces their working career by nearly a decade. If this feels too aggressive, consider instead increasing your savings rate, say, to 20%: in this case you reduce your timeline to FI by almost 15 years. Are you sure you can’t increase your savings rate now that you’re aware of the upside?
The key insight is that savings rate and asset allocation are two sides of the same coin: a high stock allocation with a 10% savings rate is “risky for your nerves”, but a low stock allocation with a 10% savings rate is “risky for your freedom”.
What about considering both levers? Perhaps you don’t want to fully eliminate your bonds. If you move from a 60/40 portfolio to a 80/20 allocation and increase simultaenously your savings rate to 15% from 10%, you’re also reducing your working career by 12 years. As observed, there are many possibilities.
To reiterate, it’s not the everyone should suddenly go 100% equities. It’s that risk tolerance decisions should be made with a clear understanding of their timeline cost. If you know that a 60/40 mix means working a decade longer and you accept that trade-off consciously, that’s completely fine. The issue is when people just do it from a position of inertia, because “a 60/40 is what everyone does”.

There’s no one-size-fits-all answer. Everyone must follow their own path when it comes to asset allocation and savings rate. Photo by Alexandre Lecocq on Unsplash.
For High Savers, Bonds Can Be a Smoother Ride
The interaction between savings rate and asset allocation isn’t just some technical detail—it can shape entire decades of your working life. At low saving rates, every percentage point of expected return matters, and a bond-heavy allocation can quietly lock you into many more cubicle years. At higher saving rates, though, the equation changes.
For high savers—those putting away 40% or more—the difference between a 100/0 and a 60/40 allocation may amount to two years or less on your road to FI. In this scenario, including bonds for a smoother, less volatile ride can make perfect sense for many. Your aggressive savings is already doing the heavy lifting, and bonds help keep the psychological aspect in check.
The key is conscious alignment.
If you’re a low saver, relying heavily on bonds can dramatically lengthen your timeline—often far more than people expect.
If you’re a high saver, bonds can be a stabilizing tool rather than a drag.
There’s no one-size-fits-all answer. But blindly adopting a “standard” 60/40 allocation without understanding its costs is a mistake. Run your own numbers, weigh the trade-offs—“nerve risk” versus “freedom risk”—and make a deliberate choice.
For the full picture on how bonds fit into a FIRE portfolio—including the bond tent and sequence-of-returns risk—see our complete investing guide.
👉 Use our free FI Calculator to experiment with your own savings rate and asset mix. We’ll send you a free link to the tool after subscribing to our email newsletter. You may be surprised to find out how much (or how little) the trade-off matters for your specific savings rate.
💬 How are you balancing your savings rate and asset allocation on the road to FI? Have you consciously chosen your mix of stocks and bonds based on your savings behavior—or defaulted to a “standard” allocation? Please let us know how you’re thinking about it in the comments below!
👉 New to Financial Independence? Start with our complete guide to Financial Independence and early retirement.
👉 Subscribe to get free FI tools and the weekly newsletter (one-click unsubscribe anytime).
🌿 Thanks for reading The Good Life Journey. I share weekly insights on personal finance, financial independence (FIRE), and long-term investing — with work, health, and philosophy explored through the FI lens.
Disclaimer: I’m not a financial adviser, and this is not financial advice. The posts on this website are for informational purposes only; please consult a qualified adviser for personalized advice.
About the author:
Written by David, a former academic scientist with a PhD and over a decade of experience in data analysis, modeling, and market-based financial systems, including work related to carbon markets. I apply a research-driven, evidence-based approach to personal finance and FIRE, focusing on long-term investing, retirement planning, and financial decision-making under uncertainty.
This site documents my own journey toward financial independence, with related topics like work, health, and philosophy explored through a financial independence lens, as they influence saving, investing, and retirement planning decisions.
Check out other recent articles


Frequently Asked Questions (FAQs)
-
Bond allocations lower expected portfolio returns. At low savings rates, these reduced returns compound over decades, significantly delaying Financial Independence.
-
At low savings rates, investment returns drive most of your FI timeline. Lower returns from bond-heavy allocations therefore have a larger impact. At high savings rates, contributions dominate, so allocation matters less.
-
Based on our calculations, a 10% saver using 60/40 could face a 50.7-year path to FI—compared to 41.6 years with 100% stocks. That’s almost a decade longer in the workforce.
-
Higher savings rates front-load capital, so compounding from contributions matters more than marginal differences in returns.
-
Not necessarily. While it shortens timelines, it comes with more volatility. For high savers, introducing bonds may only delay FI by a year or less but can smooth the ride.
-
We used 7% for 100% stocks, 6% for 80/20, and 5.1% for 60/40 allocations—based on historical averages.
-
Above ~30–40%, the gap between allocations narrows significantly. At 70%, the difference between 100/0 and 60/40 was only 6 months in our model.
-
It’s a “default” allocation historically used for balanced risk and return, but many adopt it without understanding its timeline cost at low savings rates.
-
Yes. Even moving from 10% to 20% savings can shave 15 years off your FI timeline, even with moderate bond allocations.
-
You can use our free Financial Independence Calculator to test different savings rates and bond allocations and see how they affect your FI timeline.
Join readers from more than 100 countries, subscribe below!
Didn't Find What You Were After? Try Searching Here For Other Topics Or Articles: