The ETF Fee You're Ignoring Could Cost You Hundreds of Thousands

Investing in index funds and selecting the right low-cost ETF can save you hundreds of thousands of dollars over a 40-50 year investing timeline. Photo by Austin Distel on Unsplash.
Reading time: 7 minutes
Quick answer — How much do ETF fees actually cost you?
A seemingly small difference in Total Expense Ratio (TER) compounds significantly over time. A 0.30% TER ETF leaves you with around 5.7% less after 40 years compared to a 0.07% one—that's roughly $90,000 on a $1.5M portfolio, and roughly 9 extra months of work before reaching Financial Independence. The math is represented in the heat map below.
What you'll get in this article
✔ Why ETF names and fees are so confusing and what actually matters
✔ The difference between TER, platform fees, and custody fees
✔ An original heat map showing fee drag across every TER and time horizon
✔ A worked FI Calculator example showing how fees shift your retirement date
✔ What "reasonable" fees look like for US vs European investors
TL;DR — ETF Fees & Your FI Timeline 💸
📉 ETF fees compound in reverse—shrinking your future wealth every year
💰 0.30% TER vs 0.07%: ~$90K lost on a $1.5M portfolio over 40 years
🕓 That gap translates to ~9 extra months before reaching Financial Independence
🌍 US investors: 0.04–0.07% is achievable; Europeans typically pay 0.12–0.30%
🏦 Platform and custody fees are often invisible—and just as damaging as the TER
⚙️ The fix: one afternoon comparing platforms could save you hundreds of thousands
How ETF Fees Quietly Eat Into Your Future Wealth
A 0.30% ETF fee versus a 0.07% one sounds like nothing. Over 40 years, though, that difference can remove around $90,000 from a $1.5M portfolio—and push your Financial Independence date back by nearly a year. Most investors never notice because the cost is deducted inside the fund. This article shows exactly how fee drag compounds over time, why some ETFs cost far more than others, and what it means for your FI timeline.
A friend recently asked me which ETF to choose—and the same principles apply whether you're buying ETFs or traditional index funds, since compounding costs work against you regardless of the wrapper. For most investors, especially in Europe, ETFs are the more accessible option, so that's what we'll focus on here.
After scrolling through dozens of nearly identical-sounding funds with different tickers, currencies, and costs, I realized how complex this must be for investors starting out. It's no wonder that many people manage to open their first brokerage account, only to face paralysis by analysis when they see the endless list of ETF options available today.
In today's post, we'll break down what ETF fees actually are, why some funds cost more than others, and how these small differences compound into serious money over time. Using a visual heat map (Figure 1), you'll see the long-term impact of different Total Expense Ratios (TERs) and how to avoid overpaying more than you should. Finally, we'll plug these fee differences into our Financial Independence Calculator to see what effect a few extra basis points has on our timeline to reaching early retirement.

Many investors focus on big picture items, but forget about the power of compounding costs. Photo by Sortter on Unsplash.
Why Choosing the Right ETF Is So Confusing (and What Fees Have to Do With It)
Many people have heard the good wisdom and start out with a simple goal: buy a single, low-cost ETF that tracks the global stock market and call it a day. Unfortunately, the moment you type in something like “MSCI World ETF” on your platform’s search engine, you’re hit with a wall of nearly identical names—SPDR, iShares, Amundi, Xtrackers, and more—all apparently claiming to track the same index.
But then you realize that some cost 0.12% (12 basis points), while others 0.30% or even 0.4%. It’s natural to wonder whether these name differences matter or whether it’s just marketing noise.
The reality is that ETF names are notoriously complex. Consider “iShares Core FTSE 100 UCITS ETF GBP (Dist)” or “Amundi Core MSCI World UCITS ETF Acc”. Just the name itself is enough to scare you away—before you even start understanding what’s actually inside.
Terms like “accumulating (Acc),” “distributing (Dis),” “UCITS,” “hedged,” “swap”, “1C”, and others all describe subtle structural variations that impact cost, taxation, and returns. Add sustainability labels, currency hedging, or thematic overlays, and many would-be investors decide come back to the ETF choice “some other day when they have more time.” If you want to understand exactly what each of those terms means before choosing a fund, our guide to reading ETF names breaks down every element in plain language.
The only way to really know what you’re buying is to find the ISIN code advertized in your platform, visit the provider’s official website, and read the details very carefully. But today’s post is focused on costs, so we’ll keep a deep dive into these differences for a future article.
Some of the confusion comes from the fact that ETFs are not standardized globally. Investors wanting to know which ETFs have the lowest fees should keep in mind that ultra-low-cost ETFs with expense ratios of 0.03–0.07% are mostly US-listed, offered by giants like Vanguard, iShares, and Schwab.
In contrast, European investors typically access UCITS ETFs, which follow stricter regulations, use different replication methods, and operate on smaller scales—usually pushing their costs up into the 0.12-0.3% range. Not every investor can access the lowest ETF fees—local regulations or limited platform choices sometimes justify paying a bit more. But it’s important to understand and accept why you’re paying extra, not just doing it by accident.
You can certainly find ETFs above 30 basis points (i.e., 0.30%), but you’re usually looking at niche ETFs—sector, thematic, some form of ESG funds, and others. At that point, you’re effectively stepping into active investing territory. Chasing thematic ETF funds—like Cathie Wood’s famous “ARK Innovation” fund sounds cool and exciting, but those are very concentrated bets—not broad, diversified exposure to the market. That’s not what John Bogle had in mind when he created the first index fund for retail investors to benefit from broad stock market diversification.
If you’ve ever wondered why your friend in the US can buy a 0.04-0.07% Vanguard fund while you’re paying 0.12-0.20% for something very similar, the short answer is regulation, scale, and access. In Europe, some brokers and banks often bundle ETFs with custody or platform fees, making costs even higher.
While investors outside the US will not reach those ultra-low costs, there is still substantial variation in cost that one can avoid by paying attention. As we’ll demonstrate today, it really does pay off to spend an hour opening a new account on a low-cost platform or bank that offers lower cost ETFs. In doing so you’ll be saving tens or even hundreds of thousands of euros over time.

Burgers, hot dogs, sandwhiches, and fries. In some menus you know exactly what you’re getting. Unfortunately, the ETF menu can be complex and overwhelming for new investors. Photo by Alan Kou on Unsplash.
ETF Costs Explained: What ETF Fees Are—and Why They Differ So Much
Every ETF should list a Total Expense Ratio (TER), which represents a percentage of your assets deducted to cover for management, trading, and administrative costs. This is the core ETF fee investors pay—similar to the management fee you see in index funds.
To put it simply: if your ETF has a TER of 0.20%, you lose 0.20% of your total portfolio value each year to fees. This happens automatically, before any returns are reported. A €100,000 portfolio loses €200 per year at 0.20% TER. That sounds manageable, but because compounding works on the remaining base, the cumulative effect over 20–30 years is far larger than the annual figure suggests.
The reason one MSCI World ETF costs 0.12% while another one costs 0.38% has to do with replication and scale. Large providers with billions under management can simply spread costs across more investors. But the difference is also due to factors like replication method (physical vs. synthetic), fund domicile and tax treatment, currency hedging, distribution policy (accumulating vs. distributing), or ESG and thematic overlays—all of which affect management costs.
Then there’s an additional layer most investors overlook: platform and custody fees, which many confuse with the ETF’s management fee. Some banks and brokers can charge an extra 0.2-0.3% of your total assets per year or even a fixed monthly fee for using their platform. These add up; for example, a friend of mine recently showed me on her BBVA bank investing platform an MSCI World fund that advertized 0.3% management costs plus 0.3% custody fees, which essentially behaves like a 0.6% TER ETF. That’s five times more expensive than a 0.12% option that is delivering the same stock market exposure.
In some cases, these higher costs persist simply because providers know they can get away with it—many retail investors don’t compare or switch platforms. It's the same dynamic that lets banks offer low interest rates on savings accounts for years; inertia, lack of transparency, and financial literacy keep customers overpaying.
Even small per-transaction charges—like €1 per monthly purchase—are fine as long as they’re fixed. What you want to avoid is any percentage-based fee that recurs annually. As we’ll see below, paying for convenience can easily cost you a small fortune over time.
Now that you know what drives ETF costs, let’s look at how those fees quietly compound—and what that means for your long-term returns.
ETF Fee Drag: How Small TER Differences Compound Into Huge Losses
It’s easy to dismiss fee differences as rounding errors—until you see how they compound. Our heat map below (Figure 1) shows how ETF fee differences play out over the long term. After 40 years, a portfolio invested in a 0.30% TER ETF can be around 5.7% lower in value than one invested in a 0.07% equivalent.
Imagine targeting and reaching a $1.5M FIRE number—the retirement nest egg you’re aiming for. If you succeeded with the expensive ETF, it means you may have lost around $90,000 to unnecessary costs. That is wild.
The difference increases strongly over time. After 5 years investing, the 0.3% ETF portfolio is only 0.46% lower than the 7-basis points one. After 10, 15, and 20 years, though, the difference has increased to 1.08%, 1.75%, and 2.47%, respectively. Many FIRE investors have already accumulated six-figure (or hopefully seven-figure) portfolios after so many years investing, so these seemingly small percentages represent a lot of money in absolute terms.
After 5 and 6 decades invested, your high-fee portfolio would be about 7.51% and 9.33% lower than the truly low-cost option. These are enormous amounts to leave on the table if you’re aiming for a multi-million-dollar portfolio over that timeframe.
Remember, these unnecessary costs are trickling down from a decision made a long time ago to stick with your current investing platform. Perhaps you were too busy to shop around for better options, and that has cost you, depending on the size of the portfolio, many hundreds of thousands of dollars.
The chart below illustrates how ETF fees compound over time, showing portfolio drag at different fee levels. The full underlying data from this chart is presented in tabular format towards the end of the article.
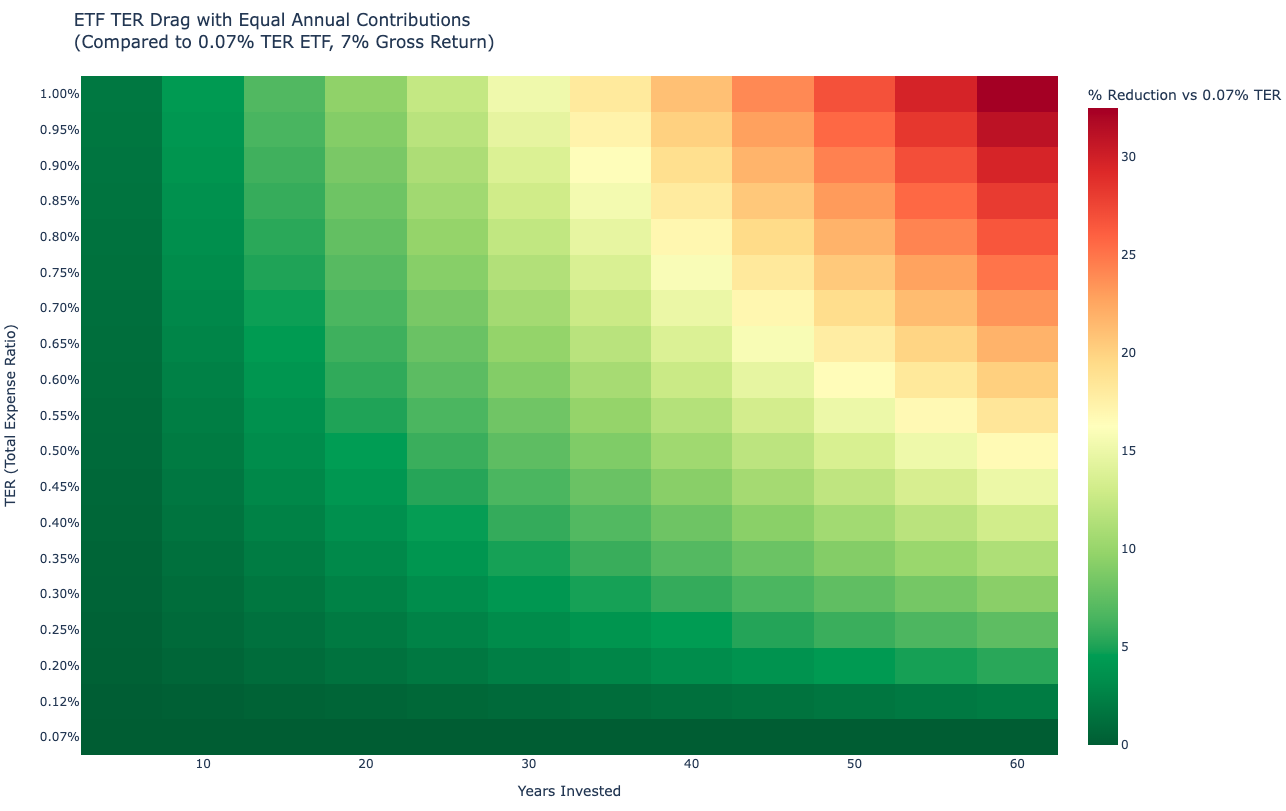
Figure 1: ETF fee drag on your portfolio. Assumes equal annual contributions and a 7% real market return. Cells express the % reduction of portfolio vs a low-cost ETF (0.07% TER). For example, after 40 years a 0.5% TER ETF has a portfolio value 10.42% lower than the low-cost one. That means a $2M portfolio at the time would have lost over $230,000 to unnecessary costs. The full table with the exact cell values is presented at the end of the article (Table 1)
Here's an example of how to use the heat map above: imagine you’re now 25 and plan to retire at 65—a 40-year investing horizon. The differences between investing in a 0.3% and a 0.07% ETF may seem like “only 0.23% per year”, but by 65, that translates to 5.7% less in your account. Again, hundreds of thousands of dollars lost.
In some cases, it could mean working additional years in your job to make up for what fees silently took away.
This logic translates also to those who pursue actively-managed funds. The vast majority of investors stock picking or investing in actively-managed funds will likely see underperformances substantially north of 1%. And this isn’t just over decades—Morningstar’s latest Active vs. Passive Barometer shows that even over one-year periods, most active managers fail to beat their benchmarks. Of course, the longer the horizon, the worse the odds get.
Even if they underperformed by just 1% annually, after 40 years they would end up with a portfolio roughly 21% smaller than if they’d just bought a low-cost index fund.
The takeaway is simple: these small numbers matter. Choosing your ETF isn’t about chasing performance; it’s about eliminating avoidable fees. Even if you invest modest sums, these percentages apply equally—the gap is proportional, not absolute. That’s why it’s worth spending an afternoon researching on lower-cost options, and, if it makes sense, to switch platforms. Nowadays, this can often be done with just a few clicks.
Would you rather lose hundreds of thousands of dollars over your lifetime or take the time to properly understand the differences between ETF providers and fill out a few forms online?

Figure 2: Actively-manage funds and stock picking is a losing game for the vast majority of retail investors. Pie charts show the percentage of actively-managed US equity-funds that underperformed their respective benchmarks for the 20-year period ended Dec. 31, 2024. Source: IFA
How ETF Fees Affect Your Time to Financial Independence
Let’s now visualize what these differences actually mean for your Financial Independence (FI) journey.
Imagine a 30-year-old earning a net annual income of $80,000, spending $60,000 a year, and investing the remaining $20,000 annually (a 25% savings rate). Their target portfolio for FI, based on the 4% rule of thumb, would be $1.5 million.
Now compare two scenarios:
Scenario A: investing in a low-cost ETF with a 0.04% ETF Fee
Scenario B: investing in a higher-cost ETF with a 0.30% ETF Fee
Under Scenario A, the investor reaches FI in about 27.2 years, hitting their $1.5 million target by age 57 (Figure 2). Under Scenario B, they reach the same number in roughly 27.9 years—about 9 months later.
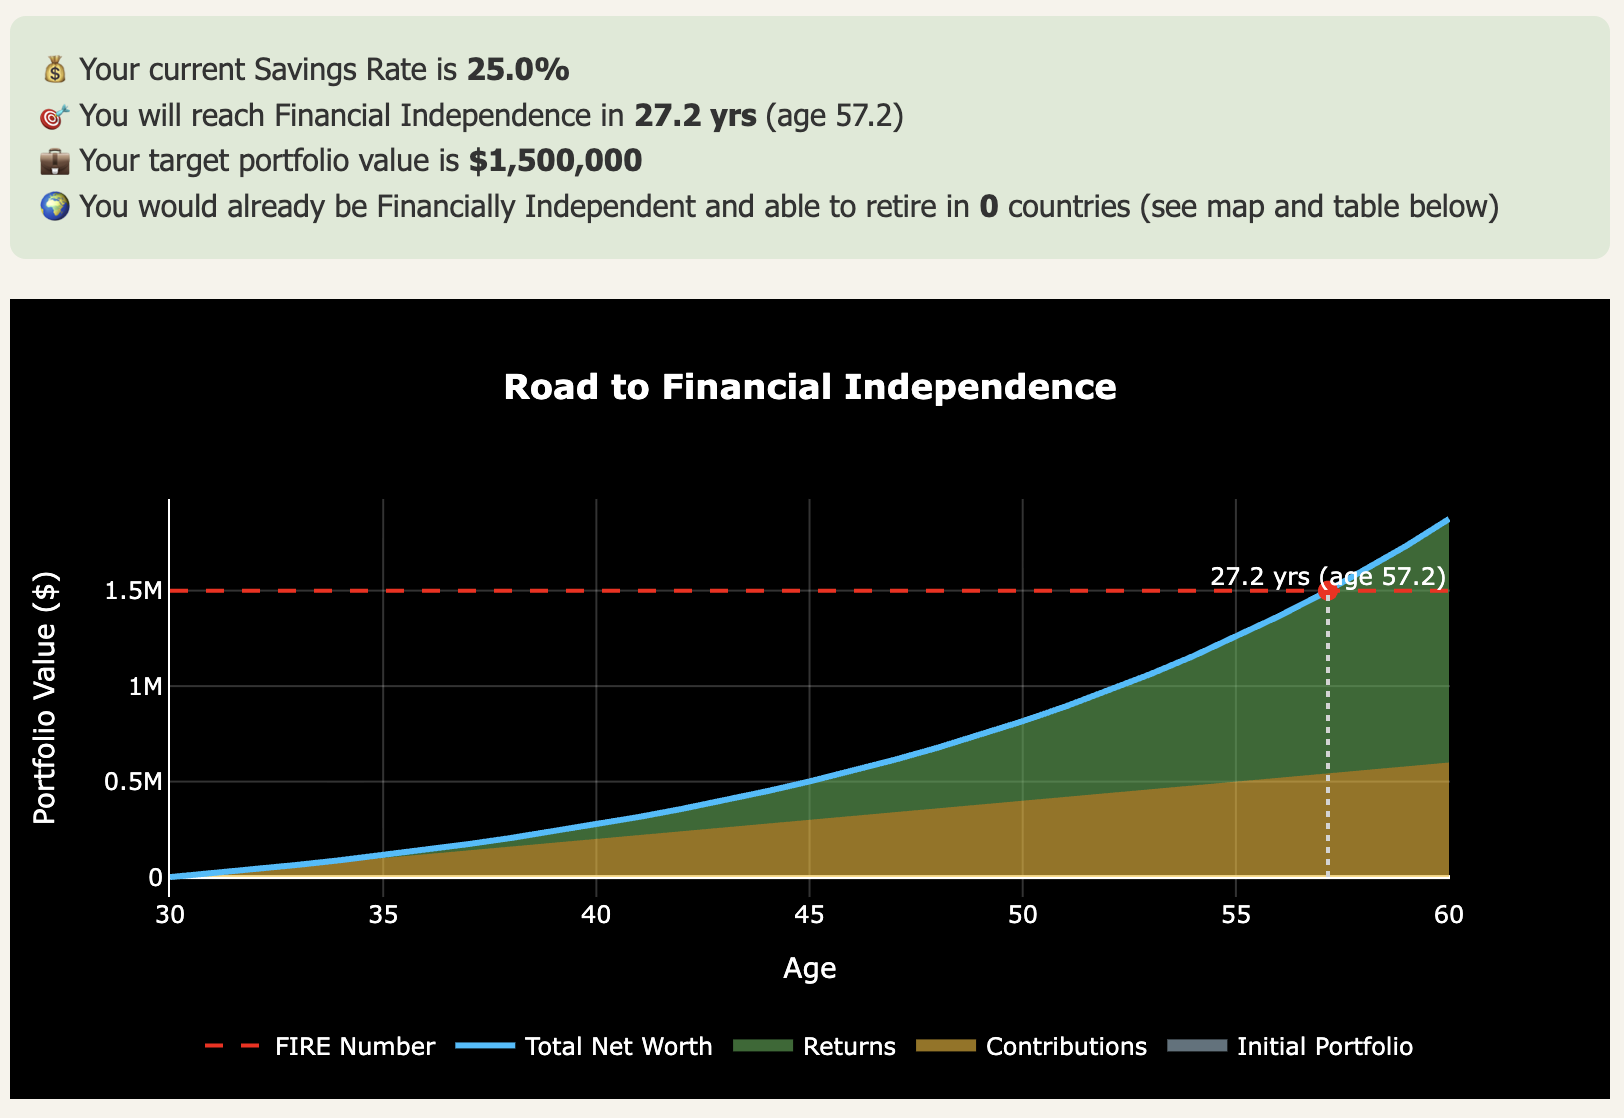
Figure 2. Screenshot of our free Financial Independence Calculator (email unlock). Enter your salary and savings and learn in 2 minutes how soon you could retire. Here we present the timeline for Scenario A (low-cost TER).
At first glance, it doesn’t sound like very much. But let’s reframe it—it’s nearly 250 extra days of getting up early, commuting, attending meetings, and living life on someone else’s schedule—just because you chose not to look at the small print on an ETF factsheet. Those same basis points could have been saved by taking the time to compare platforms or switch to a more cost-efficient option.
In practice, this gap is much larger for investors using expensive bank-offered funds or active managers charging 0.6-2.0% or more. In those cases, the days to FI could stretch up to five years. Of course, the drag continues post-retirement as those higher fees eat away at your capital each year.
So, yes, in absolute dollar terms, small ETF fee differences compound into six-figure losses over an investing lifetime. In time-to-FI terms, although the difference looks modest, it’s still months that represent your most valuable currency—freedom, and each saved basis point brings you closer to your crossover point where investments cover your living costs.
The takeaway is clear: you don’t need to obsess over every decimal point, but you should make sure you’re not overpaying for convenience. Yes, it’s a pain to switch bank or brokerage platforms, but it’s also a pain to lose hundreds of thousands of dollars.
Open a low-cost brokerage, understand what you’re buying, and stick to globally diversified, low-cost index fund ETFs.
💬 What about you? How much do you pay in ETF or fund fees right now? Would you switch platforms or providers if it saved you several months of work?
If you enjoyed this article, here are some next steps:
👉 Try it yourself: Use our FI Calculator (email unlock) to see how soon you could go into early retirement
👉 Want the full investing framework? See our complete investing guide for FIRE
👉 Browse 130+ articles on FI, investing, work, and health at The Good Life Journey.
👉 Subscribe to get free FI tools and the weekly newsletter (one-click unsubscribe anytime).
🌿 Thanks for reading The Good Life Journey. I share weekly insights on personal finance, financial independence (FIRE), and long-term investing — with work, health, and philosophy explored through the FI lens.
Disclaimers: I’m not a financial adviser, and this is not financial advice. The posts on this website are for informational purposes only; please consult a qualified adviser for personalized advice.
Table 1: ETF fee drag on your portfolio vs a low cost 0.07% ETF. To illustrate how it works: for a 40-year investing timeline, a 0.4% TER ETF would underperform a 0.07% one by 8.1%. It assumes, of course, both ETFs are targetting the same underlying index (e.g., MSCI World or S&P 500).
| TER (%) | 5 yrs | 10 yrs | 15 yrs | 20 yrs | 25 yrs | 30 yrs | 35 yrs | 40 yrs | 45 yrs | 50 yrs | 55 yrs | 60 yrs |
|---|---|---|---|---|---|---|---|---|---|---|---|---|
| 0.07% | 0.0% | 0.0% | 0.0% | 0.0% | 0.0% | 0.0% | 0.0% | 0.0% | 0.0% | 0.0% | 0.0% | 0.0% |
| 0.12% | 0.1% | 0.2% | 0.3% | 0.5% | 0.7% | 0.9% | 1.1% | 1.3% | 1.5% | 1.7% | 1.9% | 2.1% |
| 0.20% | 0.3% | 0.6% | 0.9% | 1.4% | 1.8% | 2.3% | 2.8% | 3.3% | 3.8% | 4.3% | 4.9% | 5.4% |
| 0.25% | 0.4% | 0.8% | 1.2% | 1.9% | 2.5% | 3.2% | 3.9% | 4.5% | 5.2% | 5.9% | 6.6% | 7.3% |
| 0.30% | 0.5% | 1.0% | 1.5% | 2.5% | 3.2% | 4.0% | 4.9% | 5.7% | 6.6% | 7.5% | 8.4% | 9.3% |
| 0.35% | 0.6% | 1.2% | 1.8% | 3.0% | 3.9% | 4.9% | 5.9% | 6.9% | 7.9% | 9.0% | 10.1% | 11.2% |
| 0.40% | 0.7% | 1.4% | 2.2% | 3.5% | 4.6% | 5.7% | 6.9% | 8.1% | 9.3% | 10.5% | 11.8% | 13.0% |
| 0.45% | 0.8% | 1.6% | 2.5% | 4.1% | 5.3% | 6.6% | 7.9% | 9.2% | 10.7% | 12.0% | 13.4% | 14.9% |
| 0.50% | 0.9% | 1.8% | 2.8% | 4.6% | 6.0% | 7.4% | 8.9% | 10.4% | 12.0% | 13.5% | 15.1% | 16.7% |
| 0.55% | 1.0% | 2.0% | 3.1% | 5.0% | 6.6% | 8.1% | 9.8% | 11.4% | 13.2% | 14.8% | 16.6% | 18.3% |
| 0.60% | 1.1% | 2.1% | 3.3% | 5.4% | 7.1% | 8.8% | 10.6% | 12.4% | 14.3% | 16.1% | 18.1% | 20.0% |
| 0.65% | 1.1% | 2.3% | 3.6% | 5.9% | 7.7% | 9.6% | 11.5% | 13.5% | 15.5% | 17.5% | 19.5% | 21.6% |
| 0.70% | 1.2% | 2.4% | 3.8% | 6.3% | 8.2% | 10.3% | 12.3% | 14.5% | 16.3% | 18.3% | 20.5% | 22.6% |
| 0.75% | 1.3% | 2.6% | 4.1% | 6.7% | 8.8% | 11.0% | 13.2% | 15.5% | 17.8% | 20.1% | 22.5% | 24.9% |
| 0.80% | 1.4% | 2.8% | 4.4% | 7.2% | 9.4% | 11.8% | 14.2% | 16.6% | 19.1% | 21.5% | 24.1% | 26.6% |
| 0.85% | 1.5% | 3.0% | 4.7% | 7.7% | 10.0% | 12.6% | 15.1% | 17.7% | 20.3% | 22.9% | 25.6% | 28.3% |
| 0.90% | 1.6% | 3.3% | 5.0% | 8.1% | 10.6% | 13.4% | 16.1% | 18.9% | 21.6% | 24.4% | 27.2% | 30.0% |
| 0.95% | 1.7% | 3.5% | 5.3% | 8.6% | 11.2% | 14.2% | 17.0% | 20.0% | 22.8% | 25.8% | 28.7% | 31.7% |
| 1.00% | 1.8% | 3.7% | 5.6% | 9.1% | 12.0% | 15.0% | 18.0% | 21.1% | 24.1% | 27.2% | 30.3% | 33.4% |
About the author:
Written by David, a former academic scientist with a PhD and over a decade of experience in data analysis, modeling, and market-based financial systems, including work related to carbon markets. I apply a research-driven, evidence-based approach to personal finance and FIRE, focusing on long-term investing, retirement planning, and financial decision-making under uncertainty.
This site documents my own journey toward financial independence, with related topics like work, health, and philosophy explored through a financial independence lens, as they influence saving, investing, and retirement planning decisions.
Check out other recent articles


Frequently Asked Questions (FAQs)
-
ETFs (Exchange-Traded Funds) and index funds both track market indexes like the S&P 500 or MSCI World, but they differ in how they’re traded and accessed. ETFs trade on stock exchanges throughout the day—just like individual stocks—so their prices fluctuate in real time. Traditional index funds, on the other hand, are priced once daily at the market close. ETFs often have slightly lower expense ratios and more flexibility, while index funds can be simpler for automatic investing. From a long-term perspective, though, both work the same way: they deliver market returns minus costs, so keeping fees low matters most.
-
ETF fees are expressed as the Total Expense Ratio (TER)—an annual percentage taken inside the fund to cover management, trading, and admin costs. You don’t get a bill; the fund’s net asset value reflects it. A TER of 0.30% means you effectively earn market returns minus 0.30% each year, and that drag compounds over time.
-
Yes. Even “passive” index funds and ETFs have operating costs, though broad, vanilla funds tend to be very low. In the U.S., total-market ETFs may charge 0.04–0.07%; UCITS funds in Europe are often 0.12–0.40%. The key is minimizing ongoing % fees; fixed, per-trade fees are less harmful long term.
-
Differences usually come from scale, replication method (full/optimized vs. synthetic), securities lending policies, currency hedging, distribution policy (Accumulating vs. Distributing), and the issuer’s operating model. Smaller funds and those with extra features (hedges/ESG) often charge more—even when the name looks similar.
-
For U.S.-listed broad funds, ~0.04–0.07% is common. For UCITS World/All-World funds, ~0.12–0.25% is competitive; anything above this starts to look expensive unless it offers a specific feature you need. If your platform adds custody/AUM fees on top, evaluate the all-in annual % you’re paying.
-
They add up. A 0.30% TER vs. 0.07% can leave you with ~5–6% less after 40 years (equal contributions, ~7% real return). On a €1.5M nest egg, that’s roughly €90k difference. The longer you invest, the more the gap widens because each year’s smaller base compounds into smaller future growth.
-
Yes—sometimes more. A platform that charges 0.25% of assets yearly is effectively adding a second TER. Prefer low (or zero) custody/AUM fees and accept small fixed trade fees instead. Fixed per-buy costs are manageable; ongoing % fees compound against you.
-
You can—but recognize you’re edging into active bets (sector/thematic/tilts). Higher fees plus concentration risk can underperform broad, low-cost indexes. If your goal is market-level returns for FI, keep core holdings ultra-diversified and ultra-low-cost.
-
Often, yes. A one-time account switch that reduces your ongoing TER or removes custody/AUM fees can save five-figures (or more) over a multi-decade horizon. Run the math: months of freedom later usually beats a few hours of paperwork now.
-
In euro terms, the cost gap can be huge; in years to FI, differences are usually months—not years—if comparing 0.04% vs. 0.30% on a solid savings plan. Still, those months are real life. And if you’re paying 0.6–1.0% all-in (bank funds/active), the delay can stretch to multiple years.
Join readers from more than 100 countries, subscribe below!
Didn't Find What You Were After? Try Searching Here For Other Topics Or Articles: