The Atlas of FIRE: Your Retirement Number in 100+ Countries

Your FIRE (Financial Independence, Retire Early) number depends on your expenses and therefore changes depending on where you chose to retire. Photo by Andrew Stutesman on Unsplash.
Reading time: 7 minutes
Quick answer:
Your FIRE (Financial Independence, Retire Early) number isn’t a fixed figure—but depends on where you decide to retire. The same lifestyle that may require a $1.5M portfolio and 19 years of diligent saving in the US might require far less, and fewer years, somewhere else.
In this article we hold one household’s lifestyle constant and change the retirement destination country, using our Financial Independence Calculator to map exactly how much sooner you could reach early retirement across more than 100 countries.
What You'll Get From This Article
✔ What an equivalent lifestyle costs across 100+ countries
✔ How much sooner you could retire in each—country by country
✔ Why a smaller Financial Independence number abroad can mean the same (or better) lifestyle for less
✔ The three tiers of destinations, and how to read our global early retirement map
✔ The trade-offs and the limits of these numbers to consider before deciding on relocating in retirement
TL;DR — The Atlas of FIRE 🗺️
🌍 Your FIRE number isn’t fixed—it depends on where you choose to retire
📊 Our case study: a US household needs ~$1.5M and 19 years; the same lifestyle costs far less abroad
🇵🇹 Europe’s “sweet spot” can cut ~5 years while maintaining a high quality of life
🌏 SE Asia and Latin America can cut even more—but with greater trade-offs
⚖️ The cheapest country isn’t necessarily the best retirement destination
🧭 Use the map to build a shortlist, then evaluate the non-financial trade-offs
🔗 The US is our reference point—but you can swap in your own country in our free FI Calculator
One Lifestyle, 100+ Different FIRE Numbers
We’ve made the case for geographic arbitrage before. In our geoarbitrage guide we covered this topic from many different angles, from working abroad to earn and save faster during the accumulation phase of Financial Independence (FI) to retiring somewhere cheaper to lower the portfolio you need to target in the first place.
This article applies the geographic arbitrage in retirement concept and attempts to map it globally. We take a single household with a fixed lifestyle and annual costs and change the country they decide to retire in. What happens to their FIRE number and to the number of years they’d spend working to reach it?
We refer to it as “the atlas of FIRE.” As we’ll see in more detail below, a US household targeting a $60,000 annual lifestyle needs roughly $1.5 million and about two decades of implementing a consistent savings rate to retire domestically. But when holding that same lifestyle and moving to, say, Portugal, the timeline drops by about 5 years. Move to Thailand instead and it drops by 8 years. Below, we’ll walk through the full map and the three different destination tiers, together with non-financial aspects to consider too.
This topic is personal for me too: I’m an expat currently living in Germany, and while we enjoy where we currently live, I still think a lot about where we might end up retiring to—and whether that means retiring abroad full-time or just spending part of the year somewhere warmer and cheaper (i.e., seasonal geoarbitrage) and part of the year here closer to our kids.
(A note on the reference point we use in this article: we use the US as the baseline throughout this article simply because it’s where most of our readers are based. But the principle is universal—in our free Financial Independence Tool (email unlock) you can set your own home country as the starting point and watch the entire map re-adjust around your specific annual costs. The interactive version lets you hover over any country in the map to see its exact FI timeline.)
The Baseline: One Household, One Lifestyle, One Number
For our baseline/reference scenario, we’ll model a two-person, 35-year-old household: two earners together taking home a little over the combined net pay of two median US salaries, roughly $100,000 after tax.
This couple ran into the concept of Financial Independence and got excited about the prospect of increasing their saving rate to shorten the length of their corporate careers. With little previous savings, they now spend around $60,000 per year and save and invest remaining 40% of their salary. Hopefully, we haven’t chosen a completely unrelatable profile; these are not Silicon Valley salaries, but a solid dual-income household living a solid, middle-class life.
Running those numbers through our FI Calculator, this household could reach Financial Independence in about 19 years—at age 54—with a target portfolio of about $1.5M (25x their $60,000 annual spend as per the 4% rule of thumb).
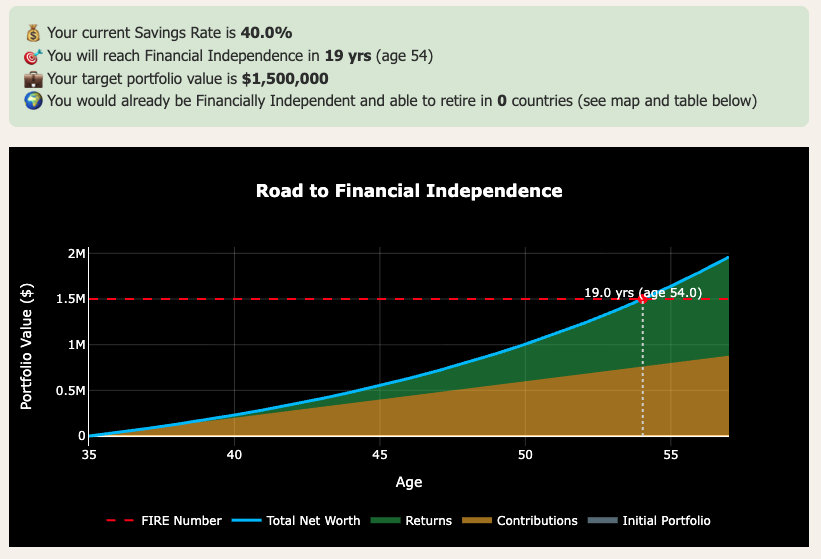
Figure 1: As per our free Financial Independence Calculator (email unlock), our case study household could reach Financial Independence in the baseline scenario in 19 years at age 54. Assumptions: a 7% real return on investments; a 4% safe withdrawal rate in retirement; and expenses in retirement the same as today.
That already puts them well ahead of the crowd—projected to reach retirement over a decade before traditional retirement. It’s worth noting this baseline projection uses a fairly conservative 4% safe withdrawal rate; at a slightly more aggressive 5%, the same household could potentially reach FI in closer to 16.5 years—almost three years sooner. Either way, for the remainder of the article we’ll stick to the conservative scenario.
Two things make this baseline useful. First, every FIRE number scales linearly with your lifestyle: if your lifestyle is closer to $120,000 annually, you would need to target a retirement portfolio that is twice as large ($3M). However, the timeline to FI doesn’t scale in the same way. Because of compounding of stock market returns, someone targeting that $3M portfolio won’t take twice as long to get there.
Second, setting this baseline will allow us to see how much sooner you could retire around the world by reducing your annual expenses in retirement while targeting the analogous $60,000 lifestyle.
👉 Wondering whether these withdrawal rates actually holds up? Our ProjectionLab walkthrough shows how to stress-test a retirement plan against nearly a century of real market data—and which levers can save you hundreds of thousands.
The Global Map: What the Same Life Costs Everywhere
In Figure 2 we present the “Atlas of FIRE” applied to our household case study. Using costs of living data aggregated by thousands of expats on Numbeo, we estimate how that annual $60,000 translates to other countries, while maintaining the same quality of life (or in many cases improving it).
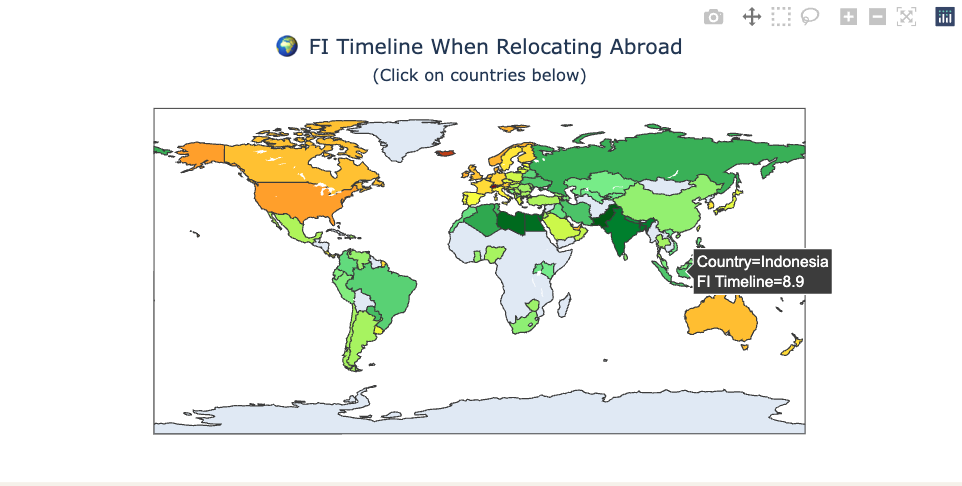
Figure 2: Screenshot of our interactive FI Calculator (email unlock). After entering your own information on annual income, spend, and existing savings you get, first, a timeline to early retirement (depicted in Figure 1 above), and, second, how the FI timeline varies if you chose to retire in a lower-cost-of-living country. It’s an interactive map where you can hover over each country to see the FI timeline change (dark green best, red worst). Below we present these numbers in a table for the case study of this article.
The cost-of-living (COL) data are derived from crowd-sourced information—real prices reported by expats living in each country. For our purposes this type of reported data is arguably more useful than official statistics. They reflect what groceries, rent, transport, and everyday life actually cost on the ground. Government data can be less reliable to compare across countries, since each country has their own methodology to calculate it. Below we present the data in tabular form. Remember, it applies to the US case study above ($60,000 annual spend, 40% savings rate).
Table 1: FI timeline by country—same $60,000 US lifestyle, replicated worldwide.
| Country | Relative Cost of Living (%) | Adjusted Annual Expenses ($) | FI Timeline (Years) |
|---|---|---|---|
| Switzerland | 137.8 | $82,652 | 22.6 |
| Singapore | 135.7 | $81,436 | 22.5 |
| Iceland | 121.4 | $72,818 | 21.2 |
| Hong Kong (China) | 121 | $72,597 | 21.2 |
| Luxembourg | 100.9 | $60,552 | 19.2 |
| United States | 100 | $60,000 | 19.1 |
| Ireland | 93.2 | $55,912 | 18.3 |
| Norway | 91 | $54,586 | 18.1 |
| Denmark | 89.5 | $53,702 | 17.9 |
| Israel | 89 | $53,370 | 17.8 |
| Netherlands | 88.2 | $52,928 | 17.7 |
| United Arab Emirates | 88 | $52,818 | 17.7 |
| Australia | 86.7 | $52,044 | 17.6 |
| United Kingdom | 85.3 | $51,160 | 17.4 |
| Canada | 84.9 | $50,939 | 17.4 |
| Austria | 80.3 | $48,177 | 16.8 |
| Germany | 78.1 | $46,851 | 16.5 |
| Qatar | 76.8 | $46,077 | 16.4 |
| Puerto Rico | 76.4 | $45,856 | 16.3 |
| New Zealand | 75.9 | $45,525 | 16.2 |
| Finland | 75.7 | $45,414 | 16.2 |
| France | 75.5 | $45,304 | 16.2 |
| Belgium | 73.8 | $44,309 | 15.9 |
| Sweden | 71.3 | $42,762 | 15.6 |
| South Korea | 70.3 | $42,210 | 15.5 |
| Cyprus | 70.3 | $42,210 | 15.5 |
| Malta | 68.3 | $40,994 | 15.2 |
| Italy | 66.9 | $40,110 | 15 |
| Bahrain | 66.3 | $39,779 | 14.9 |
| Costa Rica | 66.5 | $39,890 | 14.9 |
| Panama | 63.4 | $38,011 | 14.5 |
| Slovenia | 62.8 | $37,680 | 14.4 |
| Estonia | 62.2 | $37,348 | 14.4 |
| Spain | 61.9 | $37,127 | 14.3 |
| Trinidad And Tobago | 61.3 | $36,796 | 14.2 |
| Portugal | 60.4 | $36,243 | 14.1 |
| Kuwait | 59.3 | $35,580 | 13.9 |
| Japan | 58.2 | $34,917 | 13.7 |
| Czech Republic | 58 | $34,807 | 13.7 |
| Uruguay | 58 | $34,807 | 13.7 |
| Greece | 57.3 | $34,365 | 13.6 |
| Lithuania | 56.9 | $34,144 | 13.5 |
| Taiwan | 56.2 | $33,702 | 13.4 |
| Croatia | 56.2 | $33,702 | 13.4 |
| Armenia | 55.1 | $33,039 | 13.3 |
| Slovakia | 54.7 | $32,818 | 13.2 |
| Poland | 53 | $31,823 | 12.9 |
| Saudi Arabia | 52.3 | $31,381 | 12.8 |
| Latvia | 52.7 | $31,602 | 12.8 |
| Lebanon | 51 | $30,608 | 12.6 |
| Oman | 50.6 | $30,387 | 12.5 |
| Albania | 50.5 | $30,276 | 12.5 |
| Montenegro | 49.4 | $29,613 | 12.3 |
| Hungary | 46.6 | $27,956 | 11.8 |
| Serbia | 46.8 | $28,066 | 11.8 |
| Mexico | 46.8 | $28,066 | 11.8 |
| Turkey | 46 | $27,624 | 11.7 |
| Bulgaria | 44.6 | $26,740 | 11.5 |
| Chile | 44.8 | $26,851 | 11.5 |
| Argentina | 44.8 | $26,851 | 11.5 |
| Nigeria | 44.9 | $26,961 | 11.5 |
| Mauritius | 44.4 | $26,630 | 11.4 |
| Jordan | 44.4 | $26,630 | 11.4 |
| Thailand | 44.4 | $26,630 | 11.4 |
| Dominican Republic | 43.3 | $25,967 | 11.3 |
| Romania | 42.7 | $25,635 | 11.2 |
| Zimbabwe | 42.5 | $25,525 | 11.1 |
| Moldova | 41.8 | $25,083 | 10.9 |
| Georgia | 41.6 | $24,972 | 10.9 |
| Venezuela | 41.6 | $24,972 | 10.9 |
| Ghana | 41.3 | $24,751 | 10.9 |
| China | 40.9 | $24,530 | 10.8 |
| South Africa | 39.8 | $23,867 | 10.6 |
| Sri Lanka | 39.6 | $23,757 | 10.6 |
| Bosnia And Herzegovina | 37.4 | $22,431 | 10.2 |
| Peru | 37.8 | $22,652 | 10.2 |
| Ecuador | 37.4 | $22,431 | 10.2 |
| Azerbaijan | 37.6 | $22,541 | 10.2 |
| Malaysia | 37 | $22,210 | 10.1 |
| North Macedonia | 36.6 | $21,989 | 10 |
| Kazakhstan | 35.7 | $21,436 | 9.8 |
| Philippines | 35.2 | $21,105 | 9.7 |
| Kenya | 35.2 | $21,105 | 9.7 |
| Uzbekistan | 34.6 | $20,773 | 9.6 |
| Vietnam | 34.8 | $20,884 | 9.6 |
| Kyrgyzstan | 34.8 | $20,884 | 9.6 |
| Iraq | 33.5 | $20,110 | 9.4 |
| Morocco | 33.7 | $20,221 | 9.4 |
| Uganda | 33.5 | $20,110 | 9.4 |
| Colombia | 33.3 | $20,000 | 9.3 |
| Belarus | 32.8 | $19,669 | 9.2 |
| Brazil | 32 | $19,227 | 9.1 |
| Kosovo (Disputed Territory) | 31.9 | $19,116 | 9 |
| Ukraine | 31.5 | $18,895 | 8.9 |
| Indonesia | 31.5 | $18,895 | 8.9 |
| Iran | 30.9 | $18,564 | 8.8 |
| Paraguay | 30.6 | $18,343 | 8.7 |
| Tunisia | 30 | $18,011 | 8.6 |
| Russia | 29.1 | $17,459 | 8.4 |
| Algeria | 28 | $16,796 | 8.2 |
| Nepal | 26 | $15,580 | 7.7 |
| India | 24.1 | $14,475 | 7.3 |
| Bangladesh | 23.4 | $14,033 | 7.1 |
| Egypt | 22.5 | $13,481 | 6.9 |
| Libya | 22.3 | $13,370 | 6.8 |
| Pakistan | 20.6 | $12,376 | 6.4 |
The interactive map in the tool allows you to hover over each country to see how the timeline to early retirement changes. It’s also helpful to mentally group these countries into three broad tiers.
Tier 1: Countries more expensive than the US. Switzerland (138%), Singapore (136%), Iceland, Hong Kong, and Luxembourg all cost more than the US. For our household, retiring in Switzerland would mean increasing their portfolio target to $2.1M and pushing the early retirement timeline back by about 3.5 years.
Geoarbitrage works both ways—and here it’s working in the undesirable direction. This concept may also apply to someone working abroad in a cheaper country planning to return someday to their home country: imagine a US expat working in Spain today who wants to return to the US someday—they need to target a portfolio that will allow them to return, not just model an early retirement in Spain.
Tier 2 : The developed-but-affordable sweet spot. This group of countries is very compelling to many would-be early retirees: we’re talking about countries with good-to-excellent infrastructure, healthcare, and quality of life that costs meaningfully less than the US. Much of Southern and Eastern Europe falls in this category: for instance, Portugal (60.4% of US COL, 14 years to FI instead of 19), Spain (61.9%, 14.3), Greece, Italy, Croatia, and many others.

Coastal scene in Spain’s Basque Country. Spain ranked 2nd in our top retirement destinations in Europe. It’s northern landscapes may become increasingly sought after as climate change impacts make today’s popular retirement destinations less desirable.
What’s attractive about Tier 2 countries is that they still deliver first-world services, safety, healthcare, and a more balanced pace of life, while still allowing you to retire meaningfully earlier. For many readers coming from expensive countries, this tier offers probably the best balance of savings and familiarity. We discuss in a separate article our top 5 retirement destinations in Europe (considering also non-financial variables).
Tier 3: The deep-discount tier. In this category you find a much larger group of countries, mostly in Asia and parts of Latin America. Here the FI timeline compression really becomes strong—cuts of 8 years or more off the working career are not unusual: in Asia, Thailand (44.4% of US COL, 11.4 years to FI), Vietnam (34.8%, 9.6 years), or Malaysia (37%, 10.1 years) are long-standing expat favorites. In Latin America, Mexico (46.8%, 11.8 years), Colombia (33.3%, 9.3 years), and Ecuador (37.4%, 10.2 years) offer similar reductions. We explore our top retirement destinations in Asia and Latin America in separate articles, again, considering non-financial variables too.
While the savings here are enormous (assuming you come from a wealthier Western country), the trade-offs to consider are also relevant. Infrastructure, healthcare access, safety, air quality, or distance from family can vary substantially from country to country in relation to your current home—and, of course, the cost-of-living indexes don’t capture any of these variables. Our free Retirement Relocation Tool (email unlock) can help you think through some of these trade-offs.

Figure 3: our free Retirement Relocation Tool (email unlock) allows you to weight the importance of 9 non-financial variables and plot countries across a retirement suitability index (x axis) and cost of living (y axis). Further information and instructions in the link.
What the Numbers Leave Out
Before you screenshot the table and start making plans, it’s important to consider one caveat. Numbeo’s comparison is genuinely useful: it prices the same basket of groceries, rent, transport, and restaurants in each country, so the relative cost of living locally should be sound.
However, the gap can change when an expat’s life includes other extraordinary expenses. Two costs in particular come to mind that sit outside the standard basket: international school fees for families with children and regular flights home to visit family—which weren’t in our original $60,000 US figure at all (unless that budget included international travel).
The bottom line is that a retired couple without kids living simply may track the local index closely, while a family with kids moving back and forth a lot may not. So treat the atlas as a well-calibrated starting point, but be sure to budget and model your own numbers in our FI Calculator.
Another risk to consider is whether the retirement destination country stays cheap forever. We explore this question in detail in our article on the hidden risk of geoarbitrage.
One more item worth highlighting: these numbers assume your $60,000 crosses borders for free. In practice, converting a US pension or portfolio withdrawals into euros or baht every month has its own cost—beware because traditional banks typically embed 2–3% in their exchange rate without ever showing it as a fee. On a $60,000 annual budget, that’s about a thousand dollars a year you could be overpaying. We’ve written separately about the currency account setup that avoids overpaying hidden fees—and why it’s worth setting up before you relocate, not after.
How to Use the Map to Choose Where to Retire
So what can we actually do with an atlas, tool, and dataset like this? The idea is not to hunt for the cheapest country to retire to as early as possible—that’s almost never the right answer. Instead, I’d use it to narrow down a shortlist of retirement candidate countries: the handful of places where a meaningful cut to your Financial Independence timeline meets trade-offs you could live with. A 5-year cut to retire somewhere you’d feel at home probably beats a 10-year cut somewhere you’d feel culturally or geographically isolated.
Fortunately, you don’t have to rely on our case study example. Head to our free FI Calculator, plug in your own income, spending, and savings, and assess your personal version of the map—every country colored by how many years it would shave off your timeline. Then take your country shortlist to the Retirement Relocation Tool and pressure-test each candidate across the nine non-financial factors that will determine how much you end up enjoying your retirement destination.
If you enjoyed this article, here are some next steps:
👉 Map your own numbers across 100+ countries: our free FI Calculator (email unlock)
👉 Score your shortlist across 9 non-financial factors: Retirement Relocation Tool (email unlock)>
👉 Stress-test your plan with high-quality software: our ProjectionLab walkthrough
👉 The complete concept: Geographic Arbitrage & FIRE: The Complete Guide
👉 Actually moving? See our Guide to Managing Money Across Currencies
👉 Subscribe for weekly insights—one-click unsubscribe
🌿 Thanks for reading The Good Life Journey. I share weekly insights on personal finance, financial independence (FIRE), and long-term investing — with work, health, and philosophy explored through the FI lens.
Disclaimer: I am not a financial or legal adviser, and this content is for informational and educational purposes only. Please consult a qualified financial adviser for personalized advice tailored to your situation.
Check out other recent articles





























About the author:
Written by David, a former academic scientist with a PhD and over a decade of experience in data analysis, modeling, and market-based financial systems, including work related to carbon markets. I apply a research-driven, evidence-based approach to personal finance and FIRE, focusing on long-term investing, retirement planning, and financial decision-making under uncertainty.
This site documents my own journey toward financial independence, with related topics like work, health, and philosophy explored through a financial independence lens, as they influence saving, investing, and retirement planning decisions.
Frequently Asked Questions (FAQs)
-
Yes, dramatically. Your FIRE number is simply your annual spending times 25 (the 4% rule), so anything that changes your spending changes your number in direct proportion. Move somewhere with meaningfully lower costs of living and the same lifestyle can require a portfolio a third or even a half smaller than at home—which is the entire premise of geographic arbitrage in retirement.
-
In our case study, a US household spending $60,000 a year could replicate the same lifestyle in Portugal for roughly 60% of that cost—meaning a portfolio target closer to $900,000 instead of $1.5 million. That translates to reaching Financial Independence in about 14 years instead of 19, a five-year difference from cost of living alone.
-
The deepest discounts tend to be in Southeast Asia and Latin America— countries like Thailand, Vietnam, Colombia, or Mexico can run at roughly a third-to-half of US costs for an equivalent lifestyle. The trade-off is that these gains come with real differences in infrastructure access and distance from family, which the cost-of-living numbers alone don’t capture.
-
It’s a reasonable starting point, since it reflects real, crowd-sourced prices reported by expats rather than official statistics that are hard to compare across countries’ differing methodologies. That said, it prices a standard basket of groceries, rent, and transport—it doesn’t capture extraordinary costs like international school fees or frequent flights home, so treat it as a well-calibrated map rather than a tool to estimate your personal budget.
-
The 4% rule says you can withdraw 4% of your portfolio annually with a low risk of running out of money over a long retirement, which is why a $60,000 lifestyle implies a $1.5 million target (25 times annual spending). The rule itself doesn’t change by country—what changes is the annual spending figure you’re multiplying by 25, which is exactly what shifts when you relocate somewhere cheaper.
-
Yes—Switzerland, Singapore, Iceland, Hong Kong, and Luxembourg all run higher than typical US costs of living. For our case study household, retiring in Switzerland would mean increasing the target portfolio to roughly $2.1 million and pushing the timeline back by around three and a half years rather than shortening it.
-
The clearest risk is that “cheap” isn’t guaranteed to stay that way—popular retirement destinations can see costs rise as more expats and tourists arrive, which we cover in detail separately. Beyond cost, non-financial factors like healthcare quality, safety, air quality, and distance from family vary widely and deserve as much weight as the savings themselves.
-
The most accurate approach is to take your own annual spending, apply your target withdrawal rate (4% is the conservative standard) to get your portfolio number, then adjust that spending figure for your destination’s real cost of living rather than relying on a generic average. Our free FI Calculator does this automatically and lets you compare your own numbers across countries rather than using this article’s US case study.
-
Not necessarily—the cheapest option is rarely the right one once you weigh in quality of life, healthcare, safety, and proximity to family. A more useful approach is to shortlist a handful of countries where a meaningful cut to your early retirement timeline meets trade-offs you could genuinely live with, then pressure-test each one against your personal priorities rather than cost alone.
Join readers from more than 100 countries, subscribe below!
Didn't Find What You Were After? Try Searching Here For Other Topics Or Articles: