A Lost Decade for Stocks?

The US stock market has delivered spectacular long-run returns, but not in a straight line. The “lost decade” of 2000–2009 was one of its hardest stretches, and what it meant for investors depended entirely on where they were on their financial journey and what their portfolio looked like at the time. Photo by Keenan Constance on Pexels.
Reading time: 7 minutes
Quick answer:
A “lost decade” in investing refers to a stretch of ten years of flat stock market returns. It’s a scenario that has always scared investors, including those pursuing FIRE (Financial Independence, Retire Early). In an emerging AI-era with valuations persistently near record highs, it’s not surprising that talks about bubbles and lost decades start emerging again.
Of course, and as always, reality tends to be more nuanced than what any single flat-line of a price chart would suggest. And a lost decade can be very different depending on what stage of your Financial Independence (FI) journey you are on: if you’re still saving it can arguably be seen as a gift, while if you’re close to retiring there is real danger to be aware of and manage.
This article goes back in history and takes a look at what happened during the most famous recent “lost decade”, and what the stock market returns experienced over the 2000-2009 period. We’ll try to separate myth from fact, and show how you should respond in practice depending on what stage of your investing journey you are on. Nobody can predict what’s going to happen over the next decade; the goal instead should be to be prepared and have a robust plan in place no matter what the future may bring.
What You'll Get From This Article
✔ What happened during the “lost decade” of 2000–2009, and why it was only lost for US large-caps
✔ Why a lost decade is good for accumulators but can be very dangerous for new retirees
✔ Whether the 4% rule would have survived the lost decade of 2000-2009
✔ What protects a retirement plan: flexibility, a bond tent, diversification, and geoarbitrage
✔ Why trying to forecast the next decade (AI boom or bust) is a fool’s errand
✔ Why staying invested through a lost decade beats trying to time it
TL;DR: FIRE and the Lost Decade 📉
📊 The S&P 500’s total return over 2000–2009 was about −0.95% annualized
🏷️ For an accumulator, a lost decade is a decade-long sale: your contributions buy assets cheap
📈 It was followed by one of the strongest bull runs ever. The investor who kept buying won big
⚠️ For a new retiree, it’s the real danger: sequence-of-returns risk can permanently damage a portfolio
🛡️ Spending flexibility, a bond/cash buffer, and diversification carry a plan through
🌏 Emerging markets and small-caps beat US large-caps in the 2000s, then reversed. Diversify widely
🔮 No crystal ball: Vanguard forecast ~4.5% for the 2020s; the market delivered ~15%. Humility beats prediction
Why the Lost Decade Is Back in the Conversation
I’ll start out by saying that I personally try not to follow day-to-day finance commentary. First, it is so volatile that even if the story of the day is correct, it gives you very little insight as to what to do with that information or what comes next.
But, second, and more importantly, financial commentary from media outlets tends to be more focused on harvesting people’s attention for the short term rather than trying to produce any actionable analysis that can be helpful in the long term.
2025 and 2026 must have been a pretty wild ride for those glued to the TV’s financial channels. There were so many international shocks hitting the stock market in the short term: from Trump’s Liberation Day in April 2025 all the way to today with all the back and forth related to the Iran War and the negotiation around opening the Strait of Hormuz.
And yet, despite all of this short-term volatility, US stock valuations sit at record highs (the S&P 500 just climbed over 7,700 points for the first time as I write this). With a handful of AI-driven megacaps dominating the index, it’s not surprising that the whole AI narrative is being more closely examined.
I think nobody is questioning the ability of AI in the medium or long term to transform our societies profoundly, given that we’ve already seen many of its benefits ourselves. Related to the stock market, though, the bigger question is whether the huge amounts of money that have poured into this sector will eventually get a return on their investments, whether they will fall dramatically short, or whether some mid-ground scenario will materialize.
The dot-com era in the early 2000s saw this exact dynamic. For better or for worse, internet did change our lives, but the transformational technology did not prevent the worst market crash and ensuing “lost decade” in recent memory. There were very few winners and many losers; companies that were insanely overvalued lost all their value over a very short time frame.
I certainly don’t have a crystal ball and nobody knows for sure, but an analogous dynamic is at least one plausible scenario that could play out. Imagine the AI race does end up being a one- or few-takes-all race; well, we’d eventually see very large companies today strongly go down in value or even disappear.
On the other hand, there is also a scenario where these huge investments are simply not profitable. This fear was recently exacerbated when a Chinese model, Kimi K3, showcased its latest models, which were performing very similarly to all the US big players but at a fraction of the cost.
An AI-race to the bottom—models becoming really cheap, but still very good—might mean bad news for many larger AI companies, but at the same time could have huge benefits for both consumers and for the rest of the economy if they cheaply boost productivity. You could have a scenario where some major stocks crash but the economy continues to boom.
Again, nobody knows which scenario will play out, perhaps even a different one to the ones discussed here. With these caveats and uncertainties disclosed, let’s focus for the remainder of the article on what happens if a “lost decade” scenario does somehow materialize.
The fear is certainly legitimate. If your entire FIRE (Financial Independence, Retire Early) plan rests on stocks compounding at their historical ~7% real return, what happens if they simply…don’t deliver on your assumption? What if you retire right at what—in hindsight—is the top of the bubble? And what happens if the markets stay flat for the next 10 years like they did during the 2000s?
Rather than speculate about how the AI story will pan out, let’s examine what a real lost decade actually did to a portfolio.
The Lost Decade Was Real, but Not for Every Investor
The “lost decade” for stocks refers to the period running from December 31, 1999 through December 31, 2009, when the S&P 500 delivered a slightly negative annualized total market return over a full ten years. That was something that had only happened once before, in the 1930s during the Great Depression.
During this period, two very brutal bear markets hit within a few years of each other: the dot-com crash (2000–2002, roughly −49% in price) and the Global Financial Crisis (2007–2009, roughly −57%). From its March 2000 peak, the S&P 500 didn’t reclaim that high in price terms until around 2013, although with dividends reinvested, investors would have broken even sooner. Either way, it was around a decade of going nowhere.
Figure 1: S&P 500 annual total returns, 1997–2012. Across the shaded “lost decade” (2000–2009), two brutal bear markets (−22.1% in 2002, −37.0% in 2008) dragged the ten-year total return to −0.95% annualized. Source: SlickCharts
But although the “lost decade” is certainly a scary headline, there is more nuance to it. It was a lost decade for US large-caps specifically—represented by the S&P 500 index—but not for the stock market as a whole. As shown in Table 1 below, S&P 400 Mid-Cap, S&P 600 Small-Cap, and MSCI Emerging Markets performed quite well during this same period.
So, perhaps that is the first lesson here. The “lost decade” was lost for a single market segment. It was a decade lost to betting everything on a single country’s biggest companies. Investors holding a more diversified portfolio across company size, geography (US and international), and market type (developed and emerging) likely had a positive decade.
Table 1: Total return across different indexes during the “lost decade.” Source: Forbes
| Index | Asset class | Annualized total return |
|---|---|---|
| S&P 500 | Domestic large cap | −0.95% |
| S&P 400 Mid-Cap | Domestic mid cap | +6.36% |
| S&P 600 Small Cap | Domestic small cap | +6.35% |
| MSCI EAFE (Net) | International — developed | +1.17% |
| MSCI Emerging Markets (Net) | International — emerging | +9.78% |
| Barclays Aggregate Bond | Domestic fixed income | +6.33% |
If You’re Still Saving for FIRE, Pray for a Lost Decade
Alright, but let’s imagine for now we are not diversified and have all our wealth in the S&P 500. How does a “lost decade” affect an investor pursuing FIRE (Financial Independence, Retire Early)? It depends on whether you’re still in the accumulation or decumulation phase of FI. Let’s examine the first case first.
If you are still in the accumulation phase, especially early on or at least with many years still ahead, investing during a lost decade is a gift. When you’re contributing the same amounts automatically to your retirement and investment accounts each month (dollar-cost averaging or DCA), a flat or falling market is an opportunity to buy assets on sale.
Each paycheck allows you to buy more shares, at lower prices, than you would be able to do in a hot market. By being disciplined and investing consistently, especially when news headlines look gloomy and tempt you to back out, you’re accumulating shares very cheaply and setting yourself up for outsized gains when the recovery finally does arrive.
In our case, we’re still 4 to 7 years from FI, depending on many factors. So I’m only moderately concerned about today’s valuations; if a crash or prolonged downturn is around the corner, it means we get to keep buying long-term assets cheaply for a few more years, which should help us later on. But I’m also somewhat reassured by the fact that we don’t hold the S&P 500 alone: we’re globally diversified and deliberately hold some small-cap/value exposure too.
History shows that recovery did eventually arrive. As shown in Figure 2 below, the S&P 500 returned roughly 13.6% annualized in the 2010s, representing the longest bull market on record, which has continued all the way to 2026. The disciplined FIRE investor who patiently bought through 2000–2009 was extraordinarily well positioned when it did: their portfolio took off not just for a decade, but across the 17 years that followed.
To illustrate, someone who’d managed to follow FI principles and save a $500,000 portfolio by the start of 2010, would have seen their portfolio more than x5 to ~$2.5M in real terms over the 2010-2025 window, without considering any additional contribution during those 16 years.
👉 Curious what reaching FI looks like on your own numbers? You can estimate your timeline to early retirement, and how it changes with different stock market return assumptions, in a couple of minutes with our free FI Calculator.
Figure 2. S&P 500 annual total returns, 2010–2025. The decade that followed the lost decade (shaded, 2010–2019) returned +13.6% annualized, nearly the mirror image of 2000–2009. The disciplined investor who kept buying through the downturn was positioned for their portfolio to soar.
Hopefully this reframes the fear a little. The investor dreading a downturn at the start of their journey has it backwards. The more dangerous scenario is the opposite: a long boom that runs right up until you retire, so you spend years buying at high prices; then a downturn hits just as you start to withdraw.
Of course, the catch here is more behavioral than mathematical. It requires the discipline to continue consistently investing into the market while scary headlines are in your news feed every single day. In 2009, near the bottom of the Great Recession, financial advisers reported clients wanting zero exposure to stocks, there was simply no appetite.
Unfortunately, it was precisely those who felt most discouraged who missed the explosive recovery that followed. A lost decade only rewards accumulators who actually kept accumulating.
The main caveat, of course, is that being consistent only works if you keep your income throughout the downturn, and this isn’t always the case. Lost decades often coincide with recessions, and a job loss at the wrong moment can force you to stop contributing; or worse, sell your investments to cover living expenses. This is exactly why it’s important to have a fully funded emergency fund for the next time you may need it.
If You Just Retired, This Is the Real Risk
Now let’s consider the other side of the coin, how retiring at the beginning of a “lost decade” can threaten your retirement or FIRE plan.
For a recent retiree, the exact same decade becomes dangerous, because you’re no longer buying cheap, but selling cheap. Withdrawing a fixed, inflation-adjusted amount from a portfolio that’s falling in the early years of retirement forces you to sell more shares at low prices, so there’s less left to bounce back when the market eventually recovers.
This reflects exactly the sequence-of-returns risk (SORR) concept, which we’ve discussed at length in this blog in our deep dive on Safe Withdrawal Rates (SWRs). Two retirees with identical average return over a 30-year period can end up in completely different places depending on timing, depending on whether the bad years came first or later.
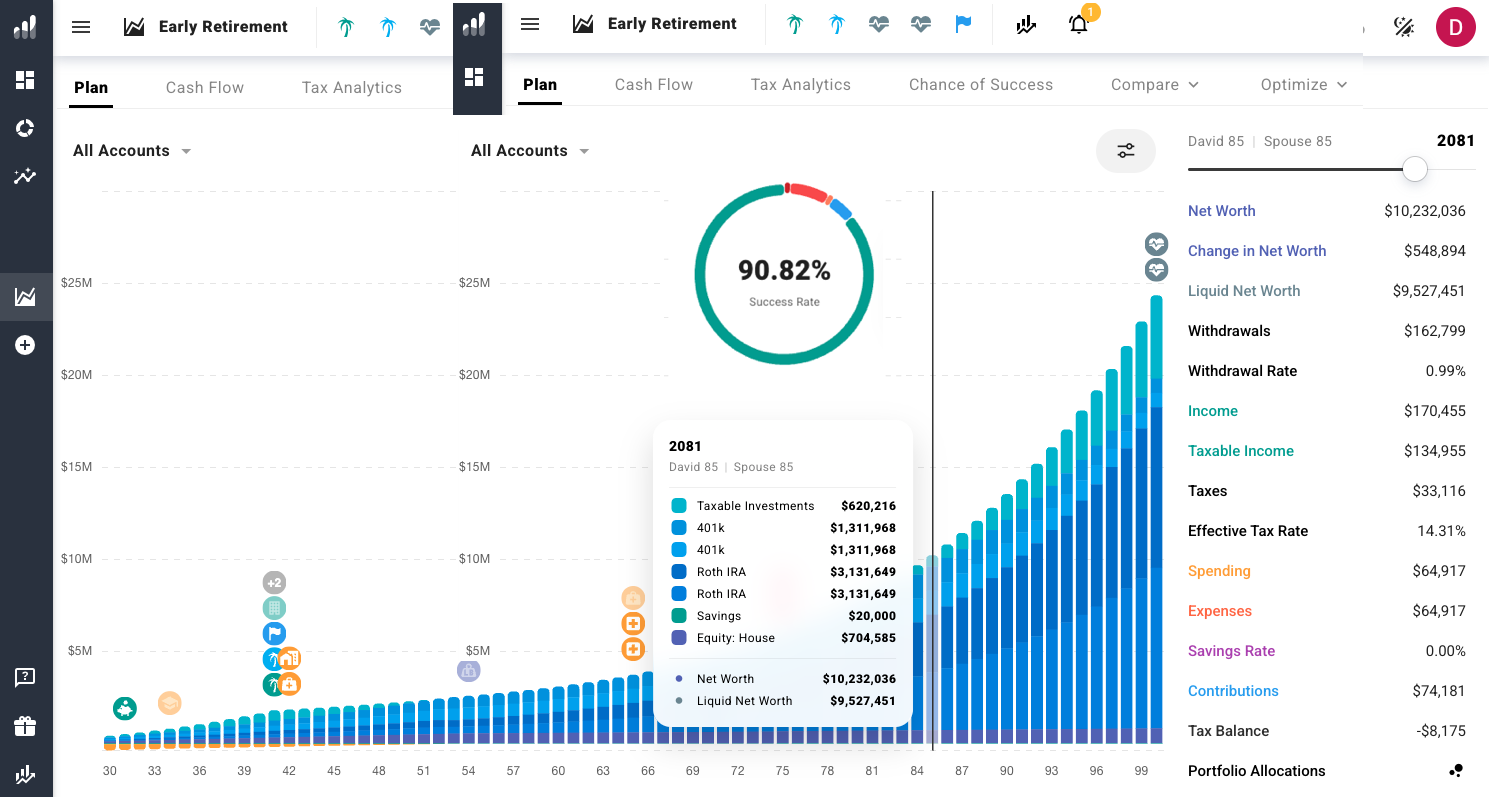
The 2000 retiree is the perfect cautionary tale. In a recent article we used ProjectionLab to stress-test a plan against different historical market sequences. In one of our examples, we obtained a 89% success rate after running our plan through 196 trial runs using market history data.
Retiring right at the 2000 peak is one of the historical starting points where things go wrong. In our ProjectionLab stress test, the household that reached FI at age 42 in the year 2000—with about $1.84M and $80K of expenses—retired straight into the lost decade. Withdrawing from a falling portfolio in those early years drained their nest egg faster than it could recover (Figure 3). By age 61 their portfolio was depleted.
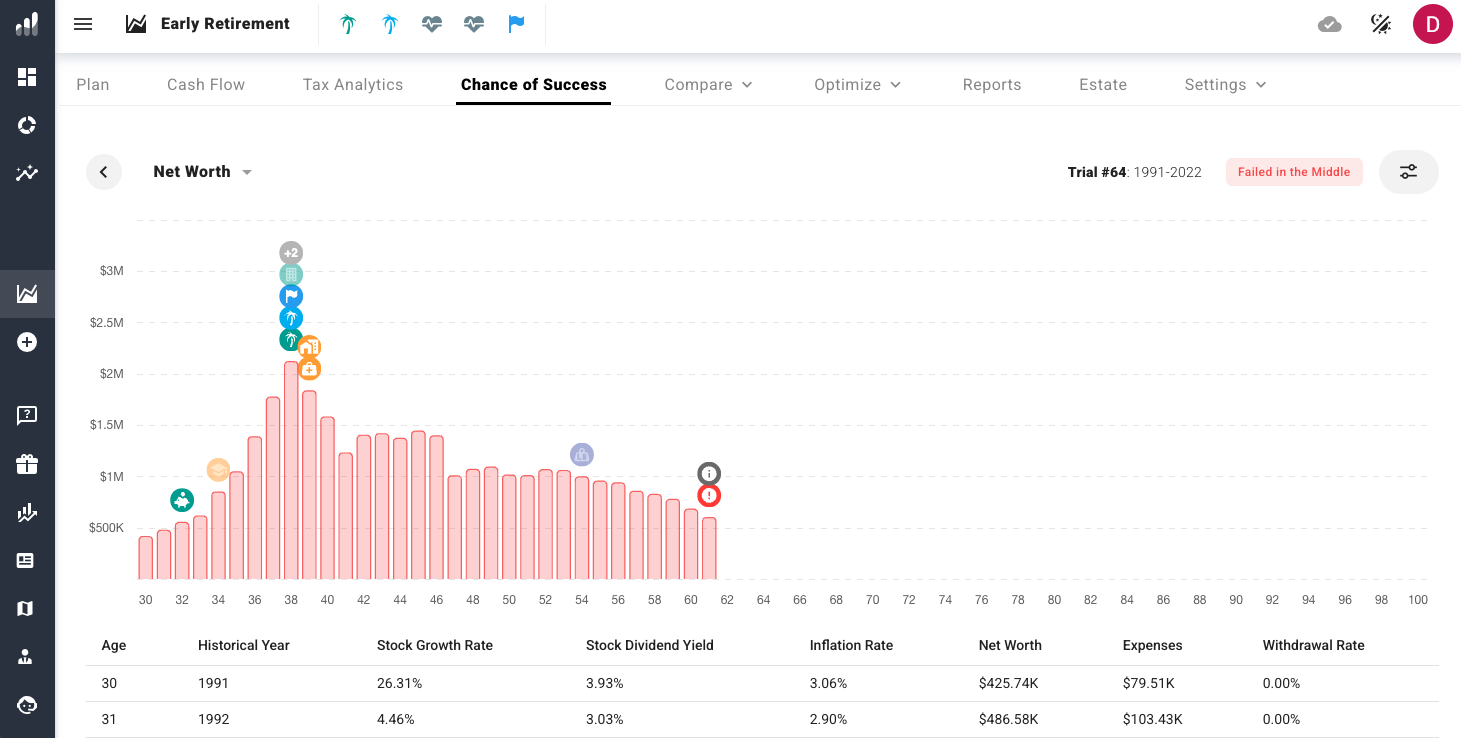
Figure 3: ProjectionLab stress-testing our FIRE household’s portfolio against the 1991–2022 market sequence. In the simulation, the household starts investing in 1991 at age 30, reaches Financial Independence and retires in the year 2000 with about $1.84M and $80K of annual expenses. Because retirement begins right at the market peak (before dot-com bubble), the drawdown phase runs straight into the 2000s lost decade. By age 61 their portfolio would be depleted and the only remaining asset would be their house. Full setup in our ProjectionLab walkthrough.
The takeaway for anyone thinking they might be retiring near a market peak is that you need to build in some protection. Some levers that can mitigate the disaster shown above, and which can be easily modeled in ProjectionLab, are:
Targeting a lower withdrawal rate in retirement. Our example above used a 5% SWR, but it clearly wasn’t enough by itself in the face of the 2000 lost decade. Targeting a 4% instead in ProjectionLab shows a 100% success chance for our specific case study.
Flexible withdrawals. Aligning your spending to stock market returns and cutting back in discretionary expenses during down years can improve portfolio survivability.
A bond tent. Increasing your bond allocation at retirement and during the first 7-10 years of early retirement can protect your portfolio against SORR.
Geoarbitrage. If you enjoy adventure and dream of spending time abroad, leveraging geoarbitrage—especially early in retirement—can dramatically increase the survivability of your portfolio (we show this very scenario in our ProjectionLab Walkthrough).
Part-time income. Modest part-time income in the early years takes enormous pressure off the portfolio precisely when sequence risk is highest. This is not dissimilar to the Barista FIRE approach.
Not retiring blind at peak valuations. Another approach is to align your withdrawals slightly with CAPE-based valuation metrics.
These aren’t just theoretical levers to me. My own plan leans on several of them: I’m open to using geoarbitrage early in retirement (there’s lower cost of living to be found both within Europe and further abroad) and I value the flexibility to trim spending during bad years rather than withdrawing blindly from our portfolio. I’ve also considered implementing a bond tent to address SORR.
None of these measures alone are guaranteed to work for your individual circumstances specifically, which is why it’s a good idea to stress test your own plan against any single or combination of levers you choose to implement.

Nobody can see clearly down the road of the next decade: AI boom, dot-com-style bust, or something in between. The goal isn’t to predict which scenario will materialize, but to build a plan robust enough to handle any of them. Photo by Stefan Prutsch on Pexels.
You Can’t Predict the Next Decade, So prepare for Any scenario
This brings us back to where we started: the AI-era anxiety about whether today is another 2000. The reality is that nobody knows, and even the track record of people whose main job is predicting long-term returns should make anyone humble.
Consider for instance Vanguard’s 2019 projected US stock returns of about 3.5% to 5.5% annually over the ensuing decade, citing trade tensions and stretched valuations. This was well below the average returns of the prior years. What actually happened? Despite a global pandemic and the 2022 selloff, the S&P 500 went on to return roughly 15% annualized over 2020–2025, about three times the top of Vanguard’s range.
The takeaway is that it’s extraordinarily difficult to predict what happens next. Rather than trying to bet any plan on a single forecast or plausible narrative, the goal moving forward should be to be prepared for any scenario.
Remember the first lesson from this article about diversification. The 2000s were a lost decade for US large-caps specifically, not for the stock market as a whole. Similarly, there were other regions in the world that performed well during this period. Bill Bengen recently updated his 4% withdrawal rate to 4.7%, despite highish valuations. He did so partially as a result of considering a more diversified portfolio. Although by backtesting portfolios one can always see the risk of overfitting, it’s probably a good place to start if you’re looking to diversify your portfolio more.
In the following years after the “lost decade”, US crushed international. So, diversifying globally isn’t a promise of higher returns; some time periods it will cost you and you may experience FOMO with regards to some of those US FIRE investors betting it all in the S&P 500. But overall you reduce the risk of reliving a catastrophic period; betting your entire plan on a single country or asset class is simply too risky.
Either way it’s important to stay invested. Since 1926, the only two negative-return decades were the 1930s and the 2000s, and both were followed by recovery. The single worst move available to a long-term investor isn’t landing in a lost decade, but letting the fear of one keep them on the sidelines entirely or selling all their positions at the bottom of it.
There is one outlier exception worth mentioning, which strengthens further the argument of not relying on any single country. Japan’s Nikkei peaked in 1989 and spent most of the next three decades below that high. An investor concentrated entirely in Japanese stocks at the 1989 peak didn’t just face a lost decade, but a lost generation.
Maybe we’re close to a continued AI boom. Maybe a dot-com-style bust, or some messy middle where a few winners compound while many of today’s leaders slowly fade. Whichever it is, don’t build a plan that depends on one narrative coming true and prepare psychologically for all three.
If you enjoyed this article, here are some next steps:
👉 Estimate your timeline to early retirement with our free FI Calculator (email unlock)
👉 Stress-test your long-term plan against market data: see our ProjectionLab Walkthrough
👉 The risk that makes lost decades dangerous for retirees: Safe Withdrawal Rates Explained
👉 New to investing for FI? Start with our Complete Investing Guide
👉 Subscribe for weekly insights. One-click unsubscribe
🌿 Thanks for reading The Good Life Journey. I share weekly insights on personal finance, financial independence (FIRE), and long-term investing — with work, health, and philosophy explored through the FI lens.
Disclaimer: I am not a financial or legal adviser, and this content is for informational and educational purposes only. Please consult a qualified financial adviser for personalized advice tailored to your situation.
Check out other recent articles





























About the author:
Written by David, a former academic scientist with a PhD and over a decade of experience in data analysis, modeling, and market-based financial systems, including work related to carbon markets. I apply a research-driven, evidence-based approach to personal finance and FIRE, focusing on long-term investing, retirement planning, and financial decision-making under uncertainty.
This site documents my own journey toward financial independence, with related topics like work, health, and philosophy explored through a financial independence lens, as they influence saving, investing, and retirement planning decisions.
Frequently Asked Questions (FAQs)
-
A lost decade refers to a roughly ten-year period where stocks deliver essentially flat or negative returns after inflation. The most famous example is 2000–2009, when the S&P 500 returned about −0.9% annualized with dividends reinvested — the only negative-return decade since the 1930s. It’s called “lost” because an investor holding US large-caps for those ten years ended up roughly where they started.
-
No — and this is the most misunderstood part. It was a lost decade for US large-caps (the S&P 500) specifically, not for stocks as a whole. Over the same period, US mid-caps, small-caps, and emerging markets all delivered positive returns, and a globally diversified portfolio came through with gains. The “lost decade” was really the cost of betting everything on one country’s biggest companies.
-
It depends entirely on your stage. If you’re still accumulating, a lost decade is a gift — your monthly contributions buy more shares at lower prices, setting up outsized gains when markets recover. If you’ve just retired, the same decade is dangerous, because withdrawing from a falling portfolio locks in losses. Same market, opposite outcomes.
-
Sequence-of-returns risk (SORR) is the danger that poor market returns early in retirement do lasting damage, even if long-run average returns are fine. Two retirees with identical 30-year average returns can end up in completely different places depending on whether the bad years came first or last. It’s the single biggest threat to someone retiring near a market peak.
-
Mostly, but with little margin. A retiree drawing an inflation-adjusted 5% from an all-stock portfolio starting in 2000 risked running out; at 4%, most historical analyses show the portfolio surviving — largely because the lost decade was followed by a strong recovery. The 4% rule works precisely because markets have always eventually recovered.
-
Several levers help: a lower initial withdrawal rate, flexible spending that trims in down years, a bond tent or cash buffer for the first several years, part-time income early on, and geoarbitrage to lower expenses. None is guaranteed individually, which is why it’s worth stress-testing your specific plan against different market sequences before you retire.
-
It protects against the worst outcome — a lost decade concentrated in one country or asset class. Global diversification won’t always deliver higher returns (US crushed international in the 2010s), but it dramatically reduces the risk of your entire plan riding on a single market’s bad decade. You give up some upside in exchange for avoiding catastrophe.
-
Nobody knows, and forecasters have a poor track record. For instance, Vanguard projected 3.5–5.5% annualized US returns for the 2020s and the market delivered roughly 15%. Today’s elevated valuations and AI concentration echo the dot-com era, which is a real reason for caution, but not a reason to abandon a plan. The answer is robustness, not prediction.
-
Japan’s Nikkei peaked in 1989 and spent most of the next three decades below that high — not a lost decade but a lost generation. An investor concentrated entirely in Japanese stocks at the peak never recovered. It’s almost certainly not a US risk to the same degree, but it’s the clearest argument for never betting your whole plan on a single country.
-
Almost certainly not. Since 1926 only two decades had negative real returns, and both were followed by recovery; over any 20-year-plus period US stocks have beaten bonds in nearly every case. The worst move isn’t landing in a lost decade — it’s letting fear of one keep you on the sidelines, or selling at the bottom.
Join readers from more than 100 countries, subscribe below!
Didn't Find What You Were After? Try Searching Here For Other Topics Or Articles: